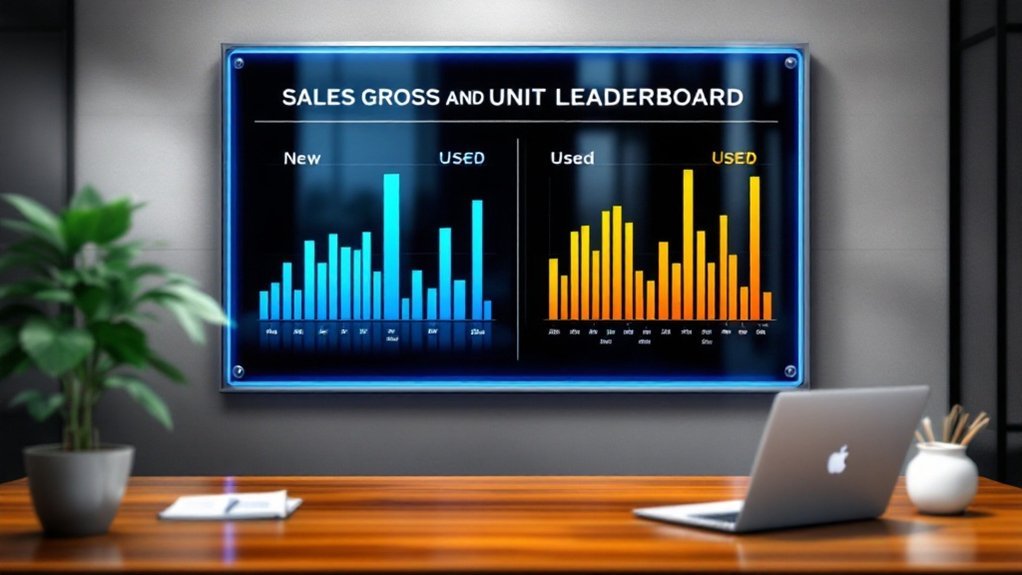
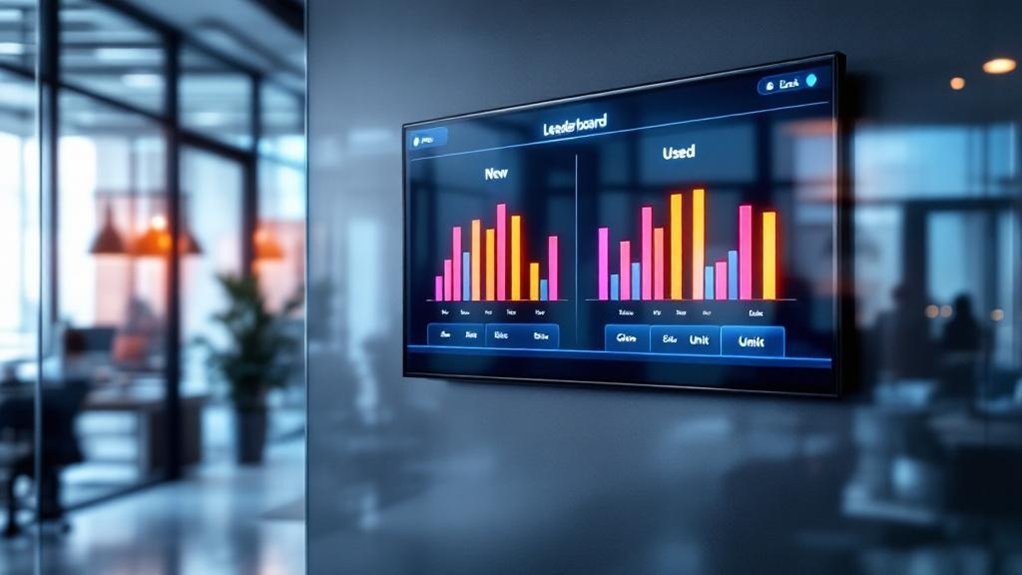
You should track daily gross-per-unit and unit sales separately for new and used departments to protect margins and drive turnover. Set individual or team leaderboards based on desired behaviors, standardize update cadence, and display ranked lists with progress bars and milestone markers. Pull live DMS data, automate point accruals, and pair leaderboard standings with diverse, non-cash rewards. Pilot with a cross-section of reps, collect feedback, and iterate—continue for setup steps, KPI examples, and rollout tips.
Key Takeaways
- Use a hybrid leaderboard showing individual and department (New vs Used) ranks for gross profit per unit and units sold.
- Update leaderboards in near real-time with daily totals, progress bars, and percent-to-goal for both departments.
- Rank by gross-per-unit and units sold separately, and display a combined score to balance margin and volume.
- Run a pilot with representative reps, collect feedback, and iterate display cadence, metrics, and reward rules.
- Tie a points-based rewards system to leaderboard KPIs, with diverse redeemable rewards and monthly audits for effectiveness.
Why Gross and Unit Metrics Matter for New and Used Departments
Numbers matter: tracking gross and unit metrics gives you a precise view of how new and used departments are performing — gross profit per unit shows whether pricing and incentives are profitable, while unit sales reveal inventory turnover and demand trends. You’ll use sales metrics to set targets: define gross-per-unit thresholds and unit-sale goals by model and channel. For performance tracking, collect daily and weekly reports, flag deviations, and trigger corrective actions like price adjustments or targeted promotions. Tie leaderboard entries to individual performance but avoid overemphasis on volume alone; balance gross and units to prevent margin erosion. Visible results drive healthy competition, improve purchasing cadence, and align marketing with seller priorities to boost acquisition and retention.
Choosing Between Individual, Team, and Hybrid Leaderboards
When you pick a leaderboard format, decide upfront whether you want to reward individual output, team collaboration, or both, because each choice changes behaviors, reporting needs, and incentives. You’ll first define goals and metrics, then choose individual, team, or hybrid displays aligned to those goals. If you prioritize accountability and personal improvement, deploy individual boards with frequent updates and clear personal targets. If you want collaboration and shared responsibility, use team boards that aggregate unit results and highlight joint wins. For mixed environments, implement hybrid boards that show both personal and team scores side-by-side, balancing competition with cooperation. Standardize update cadence, visualization (graphs, ranks), and reporting templates so performance signals stay consistent and actionable.
Selecting the Right KPIs for Short and Long Sales Cycles

For short-cycle teams, you’ll focus on fast-feedback KPIs like lead conversion rate and average sales cycle length to measure efficiency and optimize processes. For long-cycle accounts, you’ll track CLTV and opportunities generated, plus use milestone markers to monitor progress and sustain momentum. Update and review these KPIs regularly and layer daily sales volume and gross profit per unit to spot trends and adjust tactics in real time.
Short-Cycle KPI Focus
Although short-cycle sales move fast, you’ll need a tight set of KPIs—daily sales volume, units sold, average transaction value, lead conversion rate, and average sales cycle length—to spot trends, diagnose bottlenecks, and direct immediate actions. You’ll track these metrics with real-time data dashboards to monitor sales performance against daily sales goals and keep team motivation high through transparent targets. Operationally, record customer interactions and follow-up attempts per rep each shift, flagging drops in conversion rate or rising cycle length. Set thresholds that trigger specific interventions: coaching, extra touches, or pricing adjustments. Review KPIs at set intervals, update targets based on rolling averages, and document actions taken. That disciplined loop lets you capitalize on immediate opportunities and sustain short-cycle productivity.
Long-Cycle KPI Tracking
You’ve nailed short-cycle monitoring; now extend that same rigor to long-cycle sales by choosing KPIs that reveal process gaps over months, not days. You’ll implement a hybrid framework that lets you track the sales both instantaneously and over time, linking short-term indicators to long-cycle outcomes. Prioritize sales KPI selection that maps to strategic goals and customer relationships.
- Measure average sales cycle length and lead conversion rate to pinpoint bottlenecks and improve sales performance.
- Track CLTV and sales opportunities generated to guarantee long-cycle sales align with revenue objectives.
- Monitor opportunities created vs. targets and average follow-up attempts to drive rep accountability.
- Combine daily volume/CAC with long-cycle KPIs to correlate tactics with long-term results.
Designing Visuals: Progress Bars, Rankings, and Milestones
When designing leaderboard visuals, focus on clear progress bars, ranked lists, and milestone markers that let reps and managers quickly assess status against targets. You’ll implement progress bars to show percent-to-goal per rep and team, using color bands for performance tiers. Next, create rankings that sort by gross and unit metrics, updating display order to reflect current standings and drive competition. Then add milestone markers at incremental thresholds to acknowledge small wins and sustain engagement. Schedule regular visual refreshes so the display represents real-time performance without data lag. Define thresholds, color rules, and tie milestones to specific incentives. Finally, document update frequency, data sources, and rendering logic so you can audit accuracy and iterate visuals based on user feedback.
Integrating DMS Data for Real-Time Leaderboard Updates
The visual elements you designed—progress bars, rankings, and milestones—deliver immediate insight only if the underlying data is current, so connect your leaderboard to the DMS for continuous updates. You’ll map DMS data fields (gross, units, timestamps) to dashboard KPIs, schedule streaming or polling for real-time updates, and enforce validation rules to prevent stale or duplicated records. Automate imports to remove manual entry and reduce errors, and expose configurable filters for new vs used sales performance.
- Establish secure API or ETL connection to pull DMS data continuously.
- Normalize fields for gross profit, units sold, and sales pace.
- Implement real-time updates with change-data-capture and validation.
- Generate customizable reports on the sales leaderboard for targeted analysis.
Mobile Access and Remote Rep Engagement Strategies
Because mobile access delivers real-time leaderboard updates, remote reps can monitor gross, units, and pace continuously, adjust tactics immediately, and stay aligned with team goals—so implement responsive apps or PWA access, push notifications for CDC events, and lightweight offline caching to guarantee low-latency, reliable visibility. You’ll deploy a compact UI showing top metrics, thresholds, and trend arrows; sync intervals should prioritize CDC events and delta pushes under 5 seconds. Require auth, role-based views, and audit logs to protect data. Train remote reps on quick actions: review alerts, update opportunities, log calls, and flag risks. Use peer filters to surface friendly competition without exposing sensitive details. Measure impact on sales performance with A/B cohorts, retention lift, and conversion delta; iterate monthly.
Reward Systems, Points Karma, and Alternatives to Cash Incentives

Mobile leaderboard visibility lets you act faster, but reward design keeps that momentum sustainable—so pair real-time metrics with a structured points/karma system that ties specific behaviors and outcomes to redeemable rewards. You’ll map KPIs to point values, track behavioral and result-based actions, and publish progress to reinforce employee motivation via transparent recognition programs.
- Define point rules: assign points per KPI, cap tiers, automate accrual to guarantee clarity.
- Redeem options: offer experiential and non-monetary rewards to diversify incentives beyond cash.
- Participation design: include small weekly goals so all staff engage and earn recognition.
- Measurement & feedback: run monthly audits of effectiveness, adjust point weights, and report ROI on reward systems.
This procedural approach boosts loyalty and performance predictably.
Best Practices for Displaying Leaderboards on Office Screens
Effective office-screen leaderboards show real-time rankings, progress bars, and key metrics so your team can quickly grasp performance and act on it. You’ll mount large screens in high-traffic zones, configure dashboards to display gross sales and unit sales by department, and prioritize clarity: names, ranks, progress bars, and percentage to target. Feed live data at frequent intervals to keep standings current and preserve urgency; automated refreshes reduce manual errors. Use concise visualizations that align with team goals and highlight top performers and gaps. Rotate views between new and used departments and allow customizable reports for managers. Monitor exposure and adjust cadence if attention wanes. Maintain privacy controls and avoid incentivizing unhealthy competition while tracking sales leaderboards and sales performance.
Measuring Impact: Retention, Motivation, and Sales Lift

Measure the leaderboard’s impact by tracking retention rate improvements and quantifying motivation-driven lift in sales units and gross. Compare pre- and post-implementation retention and engagement metrics (e.g., +34% retention analogue, +60% engagement) and calculate percentage changes in margins and productivity. Use regular, time-bound reports to attribute sales lift to leaderboard features and adjust display or rewards based on the results.
Retention Rate Improvements
While leaderboards won’t solve retention alone, introducing competitive, real-time rankings has been shown to lift user retention by 34% (Duolingo) and boost sales performance by roughly 6–9%, so you should treat them as a measurable intervention that drives motivation and sales lift. You’ll use leaderboards to track retention rates, reinforce goals for sales staff, and quantify changes tied to engagement. Implement these steps to measure and improve retention:
- Define baseline retention and sales performance metrics, capture pre-launch data for comparison.
- Deploy real-time leaderboards, segment by role and tenure to monitor differential effects on retention rates.
- Run A/B tests for visibility and update frequency, recording staff turnover and productivity.
- Report quarterly impact, adjust incentives to sustain motivation and retention.
Motivation and Lift
Because motivation is the mechanism that turns visibility into results, you should treat leaderboards as an intervention whose impact you quantify across retention, engagement, and sales lift. You’ll measure changes: Duolingo-like retention gains (~34%), gamification adoption (72% find it motivating), and margin lifts (up to 45%). Use A/B tests and cohort analysis to isolate impact on sales performance.
| Metric | Baseline | Post-intervention |
|---|---|---|
| Retention | 100 | 134 (+34%) |
| Sales Margin | 100 | 145 (+45%) |
Operational steps: deploy leaderboards, run randomized exposure, collect weekly KPIs, track top performers, and adjust incentives. Competition among sales teams drives motivation, immediate feedback improves engagement, and sustained recognition produces measurable sales lift.
Rolling Out Your Leaderboard: Pilot, Feedback, and Iteration
When you roll out a sales leaderboard, start with a tightly scoped pilot that tests data feeds, display formats, and reward mechanics with a small, representative group so you can gather measurable usage and engagement metrics before scaling. You’ll run a pilot program with a cross-section of the sales team, collect structured feedback, and track baseline KPIs (participation, lift, accuracy). Use a fixed timeline (e.g., 30–90 days) for feedback collection and scheduled iteration cycles. Communicate updates and rationale to sustain buy-in.
- Define pilot scope, KPIs, and participant criteria.
- Collect qualitative and quantitative feedback weekly.
- Implement prioritized iterations to metrics, UI, rewards.
- Review results, scale when engagement and accuracy meet targets.
Frequently Asked Questions
What Is a Sales Leaderboard?
A sales leaderboard is a real-time ranking tool that tracks rep performance. You’ll use performance tracking tools, apply sales motivation strategies, follow leaderboard design tips, and employ effective recognition methods to drive measurable, repeatable sales behavior improvements.
How to Track Your Sales Team Performance?
You track your sales team performance by defining sales metrics, setting clear goals, implementing real-time DMS leaderboards, conducting regular performance analysis, providing feedback, using mobile access, and incentivizing team motivation through individual and team-targeted rewards.
What Is the Pulse Sales Leaderboard?
The PULSE Sales Leaderboard is a real-time dashboard you’ll use to boost sales motivation by tracking performance metrics, applying leaderboard strategies, running team competitions, and generating data-driven reports so you can coach and improve results.
What Is the Difference Between Volume Sales and Unit Sales?
Volume sales measure total revenue, while unit sales count items sold; you’ll use volume sales for revenue trends and unit sales for quantity trends. Compare both sales metrics to drive performance comparison, pricing, inventory, and forecasts.
Conclusion
You’ll finish like a coach counting the last reps: apply the leaderboard playbook, track gross and units, and split views by individual, team, or hybrid so metrics match cycles. Integrate DMS feeds for real‑time updates, visualize progress with bars and milestones, and tie rewards to measured outcomes (retention, lift). Pilot, gather feedback, iterate. Do this methodically and you’ll turn data into momentum — the same quiet math behind every winning comeback.