
You need a real-time Fixed Ops advisor leaderboard that tracks RO count, customer-pay labor gross profit, billed hours and effective labor rate so you can spot gaps and act fast. It lets you measure advisor impact on revenue, coach to specific targets, and validate pricing and capacity decisions. Integrate DMS and digital signage for live visibility and accountability, revitalizing frequently to keep momentum. Continue for practical setup, KPI prioritization, and ROI measurement tips.
Key Takeaways
- Display real-time Customer Pay RO Count and Customer Pay Labor Gross Profit on leaderboards refreshed every 15 minutes for immediate advisor feedback.
- Include Effective Labor Rate and Labor Hours Billed per RO to reveal pricing gaps and technician utilization.
- Show conversion rates and hours billed per RO alongside targets to drive focused coaching cycles and measurable improvements.
- Integrate DMS data with digital signage and ensure 99.999% uptime for continuous visibility and competitive motivation.
- Tie leaderboard metrics to service satisfaction, customer retention, and sales conversions to measure fixed-ops ROI.
Why Real-Time RO Metrics Matter for Service Advisors

Because you get immediate feedback on every repair order, real-time RO metrics let Service Advisors act on current performance instead of guessing from old reports. You’ll use these live indicators to spot trends in RO Count and Customer Pay Labor Gross Profit, driving revenue and profitability through timely decisions. With continuous visibility, you’ll adjust processes to boost efficiency and customer satisfaction, resolving issues before they erode retention. Real-time tracking creates a competitive environment that motivates Advisors to improve measurable outcomes, aligning daily activity with departmental goals. By interpreting RO metrics quickly, you’ll tailor offers to customer preferences, increase repeat business, and support a results-driven culture where performance improvements directly translate into higher revenue and stronger customer retention.
Key KPIs to Monitor on the Fixed Ops Leaderboard
You should focus on RO Count tracking, Labor Hours Billed, and Effective Labor Rate because they directly tie advisor activity to revenue, productivity, and pricing effectiveness. Monitor RO counts to gauge customer demand and retention, hours billed to measure technician utilization and throughput, and ELR to validate your pricing strategy and profit per hour. Together these KPIs give a clear, actionable view of performance you can use to prioritize improvements and incentives.
RO Count Tracking
When you track RO Count closely, you’ll get a clear, quantitative signal of your service department’s ability to attract and retain customer‑pay business — a metric that directly ties to revenue and labor gross profit and typically grows around 3% year‑over‑year in healthy operations. Monitor customer pay repair orders daily to spot declines that signal customer retention problems, aftermarket leakage, or service friction like long wait times. Higher RO Count drives revenue generation and lifts customer pay labor gross profit when you pair volume with efficient throughput. Note external impacts — recalls or vehicle quality — that can distort trends. Use effective service presentations and targeted maintenance offerings to convert visits into repeat business. Consistent RO Count growth correlates with satisfied customers and improved dealership profitability.
Labor Hours Billed
1 key metric on the Fixed Ops Leaderboard is Labor Hours Billed, which measures total customer‑charged labor hours and serves as a direct gauge of revenue generation and technician productivity. You should monitor Labor Hours Billed to spot trends in repair work and to assess service department efficiency; a 17% year‑over‑year rise signals stronger demand and better utilization of technicians. Watch Customer Pay RO Count closely — drops often precede declines in billed hours, so retaining maintenance customers is essential to sustain volume. Use this KPI with Customer Pay Labor Gross Profit to validate that higher hours translate to profitable output. Track variations by advisor and bay to pinpoint coaching opportunities, streamline processes, and lift overall dealership performance in Fixed Ops.
Effective Labor Rate
Labor hours billed tells you how much work your team is doing; Effective Labor Rate (ELR) shows what you’re actually earning per billed hour. You’ll track ELR as a core Fixed Ops KPI to pinpoint gaps between quoted rates and true labor costs, directly impacting revenue per repair order and service department efficiency. Monitoring ELR in real time on the Fixed Ops leaderboard drives competitive performance among advisors and links to Customer Pay RO Count for a fuller profitability picture. Use ELR with other performance metrics to guide pricing, staffing, and training decisions that improve customer satisfaction and margin.
- Compare ELR vs. labor hours billed to spot undercharging or inefficiency
- Cross-reference ELR with Customer Pay RO Count for revenue insights
- Trend ELR to measure advisor performance and competitive performance
How Technician Tracking Boosts Advisor Performance
With real-time tech visibility, you’ll see technician efficiency and hours billed live so you can match RO assignments to available capacity and eliminate bottlenecks. That alignment lets you set productivity targets tied to ELR and hours worked, driving both higher RO counts and customer pay labor gross. Use integrated reporting to target coaching where it moves the needle and measure gains in revenue per RO.
Real-time Tech Visibility
Visibility into technicians’ real-time performance gives you the precise data advisors need to allocate workloads, set accurate customer timeframes, and drive measurable improvements in efficiency and effective labor rate. With real-time technician tracking, service advisors see technician performance metrics instantly, so workload distribution matches current capacity and skill. That enhanced visibility sharpens customer communication and reduces quoted-time variance, boosting customer satisfaction.
- Monitor live hours and throughput to eliminate service delivery bottlenecks and raise repair order counts.
- Align advisor actions with technician trends to foster collaboration and friendly competition around KPIs.
- Use integrated metrics to pinpoint low-efficiency areas, then iterate on processes to lift effective labor rate and retention.
You’ll get faster cycles, clearer promises, and measurable ROI.
Aligned Productivity Goals
Real-time tech visibility sets the stage for measurable advisor targets, but aligning productivity goals turns those insights into action. You’ll use Tech Efficiency and Effective Labor Rate from technician performance to set measurable goals that drive repair orders and boost service department efficiency. Live performance reports reveal hours billed, gaps, and training needs so you can adjust targets and coaching in real time. Friendly competition increases accountability, lifting customer satisfaction scores as advisors coordinate with technicians to hit productivity goals. The leaderboard ties individual metrics to RO outcomes, so you can prioritize interventions that move the needle.
| Metric | Action |
|---|---|
| Tech Efficiency | Set hourly targets |
| Effective Labor Rate | Adjust pricing strategy |
| Performance reports | Weekly coaching |
| Training needs | Targeted skill programs |
Designing Leaderboard Displays for Maximum Engagement
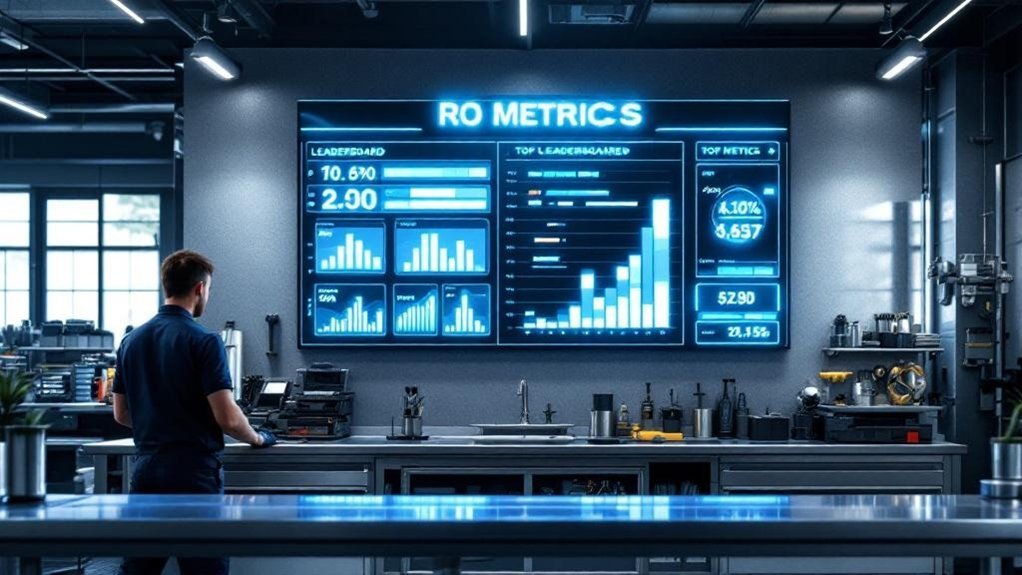
When you design leaderboard displays for maximum engagement, prioritize high-contrast colors and clear typography so key RO metrics like Customer Pay RO Count and Gross Profit are readable from across the service area; combine that visual clarity with 15-minute refresh cycles for Hours Billed and Efficiency to keep momentum and drive measurable behavior change. You’ll use digital signage that ties into DMS for real-time updates and extensive performance data, placing boards in high-traffic areas to maximize visibility and motivation. Configure customizable KPI cards to spotlight Customer Pay Labor Gross, top performers, and team targets so accountability is visible. Keep layouts uncluttered, use consistent color rules for easy scanning, and measure engagement by observing behavior shifts and metric improvements after deployment.
Prioritize high-contrast, uncluttered leaderboards with 15-minute DMS updates and KPI cards to drive visibility and measurable behavior change.
- High-contrast KPI cards for instant readability
- 15-minute real-time updates on digital signage
- Placement in high-traffic areas to boost visibility
Strategies to Turn Leaderboard Data Into Actionable Coaching
Because leaderboard metrics tie directly to day-to-day behaviors, you should use RO Count, Customer Pay Labor Gross Profit, conversion rates and hours billed per RO as the basis for short, focused coaching cycles that target specific gaps and measurable outcomes. Use leaderboard insights to pinpoint advisors with low conversion percentages or subpar hours billed, then run weekly coaching sessions that set clear, time-bound targets tied to service revenue and dealership profitability. Share customized reports so each advisor sees how RO Count and Customer Pay Labor Gross Profit affect team goals. Foster motivation through visible progress and friendly competition, but keep sessions action-oriented: identify root causes, assign skill-building tasks, and track improvement. This disciplined approach drives performance growth and sustainable revenue gains.
Integrating DMS and Digital Signage for Seamless Reporting

Coaching cycles are only as effective as the data advisors actually see, so feeding leaderboard metrics directly into your shop’s visual ecosystem closes the loop between insight and action. With DMS integrations and a managed digital signage network, you get real-time reporting of RO metrics — Customer Pay RO Count, Labor Gross Profit and other performance metrics — refreshed every 15 minutes. That seamless integration drives transparency, motivates advisors through live standings, and increases service department efficiency by aligning incentives to measurable outcomes. Reliability (99.999% uptime) guarantees uninterrupted visibility so coaching focuses on behavior, not data gaps.
- Stack Customer Pay RO Count and Labor Gross Profit for consolidated KPI views
- Push real-time reporting to floor displays to prompt immediate corrective action
- Use managed digital signage to assure continuous, accurate performance metrics
Measuring ROI: Sales, Retention, and Service Profitability
Although ROI in fixed ops hinges on multiple indicators, the most actionable view comes from tying Customer Pay RO Count, Labor Gross Profit and hours billed directly to sales and retention outcomes. You’ll track Customer Pay Labor Gross Profit and Customer Pay Hours Billed against RO Count to see whether higher spend per repair order or more hours billed drives sales conversion. Monitor service profitability through service satisfaction scores and customer retention rates to prioritize dealership offers that convert service users into buyers. Use repeat visit metrics and repair order trends to identify staffing or pricing shifts. Below is a concise snapshot of metrics to measure for clarity and action.
| Metric | Trend | Action |
|---|---|---|
| RO Count | ↓ | Boost ticket volume |
| Hours Billed | ↑17% | Optimize capacity |
| Labor GP | ↑ | Price for value |
Frequently Asked Questions
How to Measure Dealer Performance?
You measure dealer performance by tracking dealer metrics against performance benchmarks: analyze sales efficiency, service quality, customer satisfaction, revenue growth, lead conversion, inventory management, staff training, and competitive analysis to drive measurable improvement.
How Many Leads Should a BDC Rep Handle?
You should handle 50–100 leads daily, balancing BDC rep workload with Lead management strategies, Effective communication techniques, and Customer follow up processes; optimize Lead response time, Conversion rate analysis, Performance tracking tools, Daily activity reports, Training and development, Team collaboration strategies.
How to Run a Successful Automotive Service Department?
Like a well-oiled clock, you’ll drive Service Excellence by focusing on Staff Training, Workflow Efficiency, Technology Integration and Inventory Management; use Effective Marketing, Upselling Techniques, Performance Metrics, Customer Feedback to boost Customer Retention and measurable results.
What Is KPI in Dealership?
A KPI in a dealership is a measurable metric showing performance; you’ll track KPI definition across Sales metrics, Service efficiency, Customer satisfaction, Financial performance, Inventory turnover, Employee productivity, Marketing effectiveness, Lead conversion, and Competitive analysis to drive results.
Conclusion
You’ll see real-time RO metrics transform your fixed-ops leaderboard into a performance engine — not just helpful, but downright rocket-powered when it comes to focus and speed. Track KPIs, tie advisor results to technician productivity, and design displays that drive engagement; then coach from data, not gut. Integrate DMS and digital signage for seamless reporting, and measure ROI across sales, retention, and service profitability so every decision clearly improves the bottom line.