
You’ll see paid channels convert faster but cost more per lead, while organic sources convert slower with lower CPL and longer nurture cycles. With conversion-to-sold tracking you shift from CPL to cost-per-sale and revenue-weighted attribution, revealing true channel ROI and LTV differences. Multi-touch attribution and micro-conversion mapping pinpoint high-value touchpoints. Integrate CRM and deterministic offline tracking to reconcile revenue and CAC. Keep going to see specific attribution models, KPIs and optimization tactics.
Key Takeaways
- Compare cost-per-sale (CAC) by channel using conversion-to-sold tracking instead of cost-per-lead to measure true ROI.
- Apply revenue-weighted attribution to allocate sale value across paid and organic touchpoints for accurate channel ROI.
- Report LTV:CAC by lead source with cohort analysis to normalize acquisition date and lifecycle differences.
- Map multi-channel touchpoints and micro-conversions to identify high-value sequences that boost paid and organic effectiveness.
- Integrate CRM and offline tracking (unique numbers, promo codes) to reconcile revenue with digital lead sources for reliable dashboards.
What Paid and Organic Lead Sources Look Like in BDC Reports

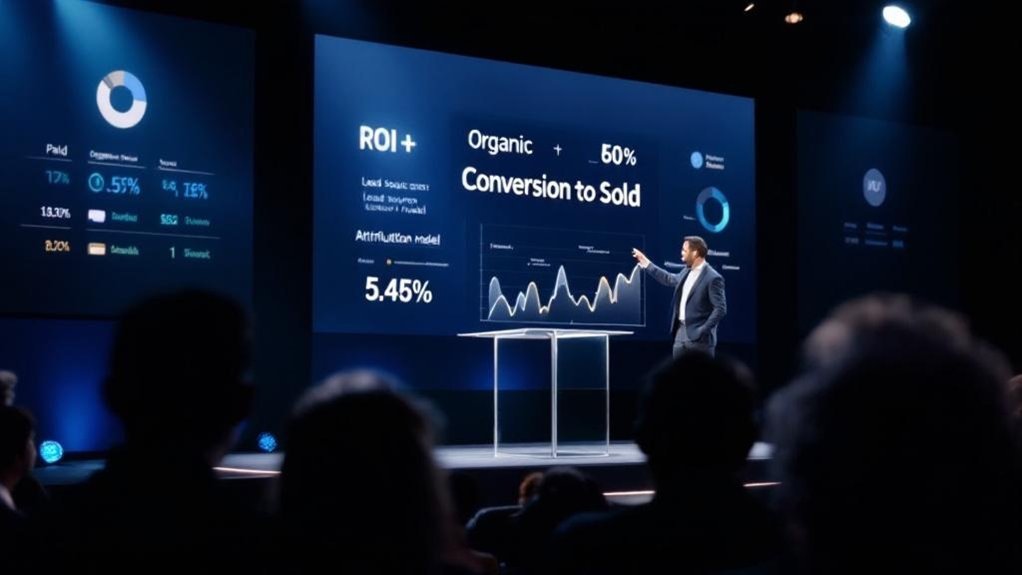
Reports split lead sources into paid and organic buckets so you can directly compare metrics like conversion rate, cost, and time-to-sale; paid channels (e.g., Google Ads) typically show higher immediate conversion—around 3.2%—while organic sources (e.g., SEO) average about 2.7% but require longer nurture cycles. You’ll see Paid and Organic segments listed with baseline Conversion Rates, cost-per-lead, and time-to-sale distributions. Paid rows highlight higher CPL and shorter median time-to-sale; Organic rows show lower CPL but extended nurture velocity. The dashboard ties conversions to sold outcomes so you can model ROI per channel accurately. You’ll use these relative metrics to prioritize budget allocation, adjust bidding strategies for Paid, and scale content or technical SEO investments for Organic.
Why Conversion-to-Sold Tracking Changes ROI Calculations
When you track leads through to sale, you convert interaction counts into monetized outcomes and remove attribution noise that skews channel ROI. Using revenue-weighted attribution reallocates credit based on actual sale value, not just first- or last-touch counts, so ROI reflects true contribution to profit. That shift lets you prioritize channels by revenue per acquisition and adjust spend with measurable impact on bottom-line returns.
Tracking Leads to Sale
Conversion-to-sold tracking gives you a direct, revenue-based lens on lead performance by linking individual leads to completed transactions, which fundamentally alters ROI calculations from cost-per-lead to cost-per-sale. By implementing conversion tracking you’ll attribute revenue to specific sources, so marketing performance metrics reflect actual value rather than volume. You’ll map the customer journey across touchpoints, quantify lead-to-sale conversion intervals, and detect where drop-off inflates apparent effectiveness. That visibility lets you reallocate spend toward channels producing shorter sales cycle and higher close rates. Metrics shift from crude lead counts to sale-weighted outcomes, improving predictive models and reporting accuracy. Operationally, you’ll use these signals to tighten follow-up cadence, adjust campaign mix, and raise true ROI.
Revenue-weighted Attribution
Although tracking leads is useful, revenue-weighted attribution reframes ROI by tying each conversion to actual sale value so you measure dollars per source rather than leads per source. You’ll implement conversion-to-sold tracking to map revenue back to originating touchpoints, shifting metrics from volume and conversion-rate to revenue-per-lead and lifetime value. This lets you quantify marketing effectiveness across paid and organic channels, allocate budget to net-positive sources, and test hypotheses with monetary KPIs. By instrumenting the customer journey end-to-end, you’ll identify which sequences produce high-value sales versus low-yield leads. The approach de-emphasizes short-term counts and emphasizes retention-weighted contributions, enabling statistical comparison of channels on revenue impact, margin-adjusted ROI, and long-term profitability rather than raw lead counts.
Mapping the Customer Journey Across Paid and Organic Channels

You’ll map multi-channel touchpoints to quantify how paid and organic interactions sequence before conversion, using session-level and event data. Then you’ll apply attribution-pathway analysis to assign credit across touchpoints, comparing models (last-click, time-decay, algorithmic) against observed conversion rates (paid 3.2%, organic 2.7%). This lets you identify high-value pathways and optimize bids, creative, and keywords to improve ROI.
Multi-Channel Touchpoint Mapping
When you map multi-channel touchpoints across paid and organic channels, you’ll quantify the sequence of interactions that lead to macro-conversions and surface which touchpoints most consistently influence buying decisions; tracking micro-conversions like form fills and newsletter sign-ups lets you assign partial credit and pinpoint where messaging or budget shifts will most improve ROI. You’ll instrument channels to capture timestamped events across paid search, display, social, email, SEO and direct visits. Multi-channel touchpoint mapping normalizes touch data, reconstructs customer journeys, and calculates incremental lift on conversion rates per channel combination. Use cohort analysis and funnel drop-off metrics to identify high-value touchpoints. Translate insights into a reallocated marketing strategy, adjusting spend and creative to maximize leads-to-sold efficiency while reducing acquisition cost and improving lifetime value projections.
Attribution Pathway Analysis
Because customer journeys span paid search, display, social, email, SEO and direct visits, attribution pathway analysis reconstructs timestamped touchpoints to show which sequences most consistently lead to conversions and where incremental value is created. You’ll quantify sequences that begin with a paid search ad and end via organic touch or direct sale, comparing relative lift and average conversion rate by path. This lets you optimize spend for customer acquisition and refine organic content that supports paid funnels. Key outputs you’ll use:
- Path-level conversion rates and time-to-convert for top 3 sequences.
- Incrementality matrix showing where paid search ad adds unique conversions versus cannibalizing organic.
- Resource allocation model that ties spend to expected customer acquisition cost.
Use these metrics to improve ROI and channel mix decisions.
Identifying and Measuring Micro-Conversions for Lead Quality
Although micro-conversions like newsletter sign-ups, gated-content downloads, or contact-form completions don’t close deals, they provide measurable signals of lead intent and engagement that you can quantify and act on. You’ll track micro-conversions to score lead quality, segment audiences, and prioritize follow-up. Measure conversion rates at each funnel stage, tie micro-events to revenue where possible, and use the data to refine marketing strategies. Focus on rate drop-offs to find bottlenecks and run A/B tests to improve lift. Use cohort analysis to validate which micro behaviors predict macro sales and allocate budget toward channels yielding higher-quality leads.
| Metric | Purpose |
|---|---|
| Sign-ups | Engagement signal |
| Downloads | Interest depth |
| Form fills | Contactability |
| Click-to-call | Purchase intent |
| Revenue per lead | Quality validation |
Attribution Models That Reveal True Channel Value
Attribution models are the quantitative framework you use to assign credit across touchpoints so you can measure each channel’s true contribution to revenue. You’ll choose models to map how marketing efforts produce conversion and sold outcomes, avoiding overcrediting last-click signals. Use multi-touch for thorough channel performance, first-touch to surface discovery drivers, and linear to equalize influence across interactions. Advanced time-decay and position-based models weight proximity to conversion, refining ROI estimates.
- Multi-touch: captures cumulative impact of multiple interactions on conversion.
- First-touch: isolates origin channels responsible for lead generation.
- Linear: allocates equal credit to each touch to prevent attribution bias.
Implement model comparisons to quantify lift per channel and optimize marketing efforts.
Tracking Offline Conversions and Revenue From Digital Leads
When you tie digital touchpoints to offline outcomes, you’ll get a quantitative view of which channels actually drive revenue rather than just clicks or form fills. You’ll implement tracking offline conversions by assigning unique phone numbers, emails, and promo codes per campaign to map paid and organic lead sources to sales. Use marketing automation tools to stitch touchpoints into customer journeys and quantify revenue per lead source. Share datasets across sales, service, and marketing to validate conversion-to-sold records and refine ROI calculations. The result is a deterministic revenue attribution layer that lets you compare CAC and LTV by channel and optimize spend.
| Metric | Purpose |
|---|---|
| Unique IDs | Attribute offline sale to lead source |
| Promo codes | Validate campaign-to-revenue mapping |
Best Practices for Integrating CRM and Marketing Data

Because your CRM and marketing systems each hold partial views of the customer lifecycle, integrating them tightly is essential to produce reliable, actionable attribution and ROI metrics. You’ll centralize touchpoints, correlate lead sources to outcomes, and feed conversion-to-sold metrics back into campaign decisions. Use marketing automation tools to normalize event schemas, unify IDs, and automate attribution models. Maintain rigorous data quality checks and audit trails to prevent skewed ROI from duplicate or missing records.
Integrate CRM and marketing data to centralize touchpoints, unify IDs, and automate attribution for accurate, auditable ROI.
- Enforce a canonical lead identifier across CRM and marketing platforms.
- Automate ETL with schema validation and timestamped logs for conversion-to-sold metrics.
- Schedule periodic data quality checks and reconcile lead sources against revenue records.
This approach produces reproducible, measurable insights for budget allocation.
Optimizing Paid Search for Faster, Higher-Quality Leads
Although paid search delivers immediate, measurable demand, you should optimize for both speed and lead quality by focusing on conversion-rate improvements, bid efficiency, and intent-aligned creative. You’ll target higher-quality lead generation by raising conversion rates from the 3.2% average via tighter keyword match, improved landing pages, and higher CTR creative (6.42% benchmark). Monitor CPC ($4.66 avg) to balance volume vs. cost, use audience signals to prioritize intent, and feed outcomes into CRM for ongoing optimization. Combine paid search with organic search to capture both immediate and sustained demand; organic reduces acquisition pressure while paid accelerates pipeline. Measure post-click quality (lead-to-sale) to validate paid spend against organic contributions.
| Objective | Metric | Tactic |
|---|---|---|
| Speed | CTR 6.42% | Broad-to-specific keywords |
| Quality | Conversion rates 3.2% | Landing page testing |
| Cost | CPC $4.66 | Bid efficiency rules |
How to Compare Lifetime Value and CAC by Lead Source

To compare LTV and CAC by lead source, you’ll start by specifying LTV calculation methods (historical revenue-per-customer, predictive cohort projections, or discounted cash flows) and guarantee consistent time horizons. Then apply CAC allocation models — direct channel spend, weighted multi-touch attribution, or cohort-level shared-cost apportionment — to assign acquisition costs accurately. Finally, run cohort-based comparisons to normalize for acquisition date and behavior, report LTV:CAC ratios by cohort, and flag channels that fall below the 3:1 healthy benchmark.
LTV Calculation Methods
When you segment customers by lead source, calculating LTV alongside CAC lets you quantify which channels deliver sustainable returns rather than rely on intuition; LTV is typically modeled from average purchase value, purchase frequency, and retention curves while CAC aggregates all marketing and sales costs per acquired customer, and comparing their ratio (aiming for ~3:1) highlights profitable sources and those needing optimization.
Use LTV calculation methods that are reproducible and source-segmented. Estimate cohort retention curves, compute average revenue per user (ARPU) per period, and discount future cash flows if needed. Pair these with CAC to evaluate whether marketing campaigns provide scalable return on investment.
- Cohort-based LTV: retention × ARPU over time.
- Predictive LTV: survival analysis or machine learning.
- Simple LTV: average purchase × purchase frequency × lifespan.
CAC Allocation Models
If you want to compare LTV and CAC by lead source accurately, you need a clear CAC allocation model that assigns every acquisition expense to the correct channel and time window so per-source CAC aligns with cohort-based LTV estimates. You’ll map fixed and variable acquisition costs (ad spend, agency fees, attribution platform, creative) to lead sources using deterministic assignment rules or weighted multi-touch splits. Calculate per-source CAC over the same retention horizon used for LTV, then compute LTV:CAC ratios—targeting ~3:1 for sustainable growth. Regularly reconcile attribution windows, address cross-channel assists, and normalize for cohort size. Continuous monitoring of CAC and LTV by lead source lets you reallocate budget to maximize marketing ROI and unit economics.
Cohort-Based Comparison
Having established a deterministic CAC allocation model, you can now run cohort-based comparisons that align per-source CAC with the same retention windows used for LTV. You’ll segment cohorts by lead source, measure conversion-to-sold ratios, and calculate LTV and CAC per cohort to reveal true channel efficiency. Compare cumulative LTV over fixed intervals (30/90/365 days) against allocated CAC to compute payback periods and ROI.
- Segment cohorts by lead source and acquisition date for consistent retention windows.
- Track conversion-to-sold and revenue per cohort to compute cohort LTV and margin.
- Calculate cohort CAC including attribution of platform spend, creative, and BDC costs.
These analyses let you reallocate spend toward lead sources with superior LTV:CAC profiles and shorter payback.
Reporting Metrics and Dashboards to Prove Channel ROI
Dashboards are your most practical tool for proving channel ROI: they should combine conversion-to-sold tracking, CPL and CAC KPIs, and micro-conversion metrics so you can quantify which sources actually generate revenue. You’ll configure reporting metrics to show real-time channel performance, segmenting paid search and organic search to compare conversion funnels. Include conversion-to-sold ratios, CPL, CAC, micro-conversion velocity (form submits, newsletter sign-ups) and cohort retention to surface lead quality differences. Use the 3.2% paid search and 2.7% organic search benchmarks to calibrate alerts and budget shifts. Present data in concise visual panels with filters by date, campaign, and cohort so you can rapidly reallocate spend toward channels with superior revenue-per-lead and lower acquisition cost.
Frequently Asked Questions
What Is the Difference Between Paid Leads and Organic Leads?
Paid leads come from paid campaigns, while organic leads arise from unpaid channels; you’ll use lead generation and marketing strategies differently for customer acquisition, optimizing sales funnels based on conversion velocity, cost-per-acquisition, and lifetime value data.
What Percentage of Leads Are Converted to Sales?
About 2.9% of leads convert to sales. Remember the marathon runner who paces for finish lines—use that lead conversion data point: optimize sales funnel, prioritize lead quality, and refine marketing strategies for steady gains.
What Is the Average Conversion Rate for Organic Search?
About 2.7% is the average conversion rate for organic search. You’ll analyze conversion factors, apply SEO strategies, and use lead nurturing to raise performance, leveraging data-driven testing and technical optimization to improve outcomes.
What Is the Difference Between Paid and Organic Traffic?
Paid traffic’s paid advertising gives immediate, targeted visibility with higher short-term conversion rates; organic growth produces sustained, trust-driven leads. You’ll use different traffic sources for complementary lead generation, balancing cost, timing, and long-term ROI.
Conclusion
When your paid and organic numbers line up—coincidentally showing similar conversion-to-sold rates—you’ll see that channel ROI isn’t about wins alone but measurement fidelity. You’ll need mapped touchpoints, micro-conversion tagging, and matched CRM marketing records to attribute value correctly. Use cohort LTV, CAC by source, and multi-touch attribution to quantify true return. Do this, and you’ll stop guessing and start optimizing budgets based on verifiable, repeatable data-driven outcomes.