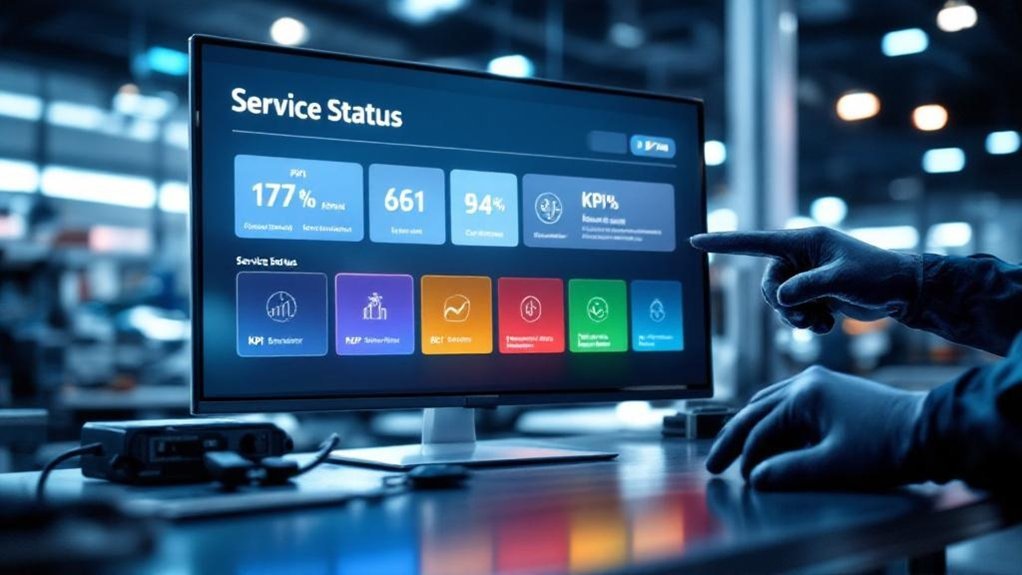
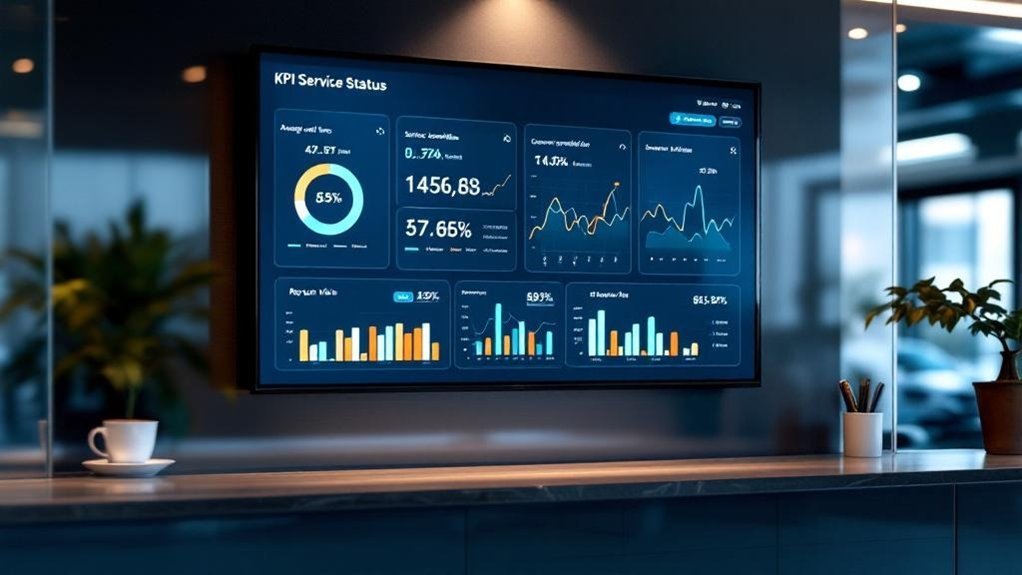
You should show seven clear KPIs: Effective Labor Rate, Hours Sold per Repair Order, Technician Productivity (hours billed per tech), Service Gross Profit %, Repair Order Count and Cycle Time, Customer Retention and Return Rate, and Appointment Show Rate with No‑Show %. Each metric drives technician efficiency, increases average hours per RO, and protects margin while keeping customers coming back. Display real‑time targets and trends to act fast. Keep watching these numbers and you’ll uncover practical steps to boost revenue and loyalty.
Key Takeaways
- Display Technician Productivity (hours billed per tech) to monitor utilization against a 70% target and spot coaching needs.
- Show Effective Labor Rate (revenue per billed hour) to track pricing and technician efficiency in real time.
- Present Service Gross Profit Percentage to monitor margins and detect rising costs or pricing issues quickly.
- Include Repair Order Count and Average Cycle Time to manage workload, staffing, and aim for under 24-hour turnaround.
- Track Customer Retention and Return Rate (12-month cohort) to measure loyalty and prioritize outreach for at-risk customers.
Effective Labor Rate
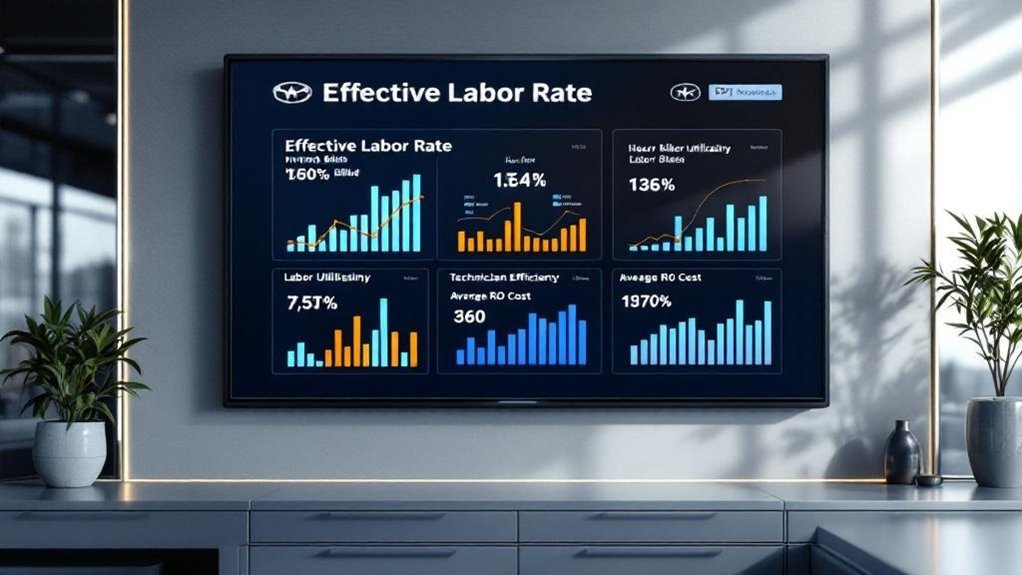
Track the Effective Labor Rate by dividing total labor sales by total billed labor hours — it tells you how much revenue you’re generating per billed hour. You should calculate effective labor regularly to spot trends, measure technician efficiency, and align daily operations with revenue strategies. A rising rate means you’re maximizing billable time and boosting service-department profitability; a falling rate flags scheduling, pricing, or productivity issues needing immediate action. Monitor this KPI on your Service Status TV so managers and technicians see real-time performance and adjust priorities. Benchmark against industry standards to set realistic targets and refine training, flat-rate pricing, or upsell tactics. Use concise reports and visual alerts to drive accountability and continuous improvement in revenue strategies.
Hours Sold Per Repair Order
To maximize RO revenue you’ll want to track Hours Sold per Repair Order (HRO) and set clear targets for average billed hours per RO. Focus efforts on reducing one-item ROs by promoting bundled maintenance and multi-point inspections to increase billed hours without overcharging customers. Monitor at least 100 ROs per advisor monthly to guarantee the improvements are real and customer satisfaction stays high.
Maximize RO Revenue
Boosting hours sold per repair order is one of the fastest ways you’ll lift service department revenue and technician utilization; aim to analyze at least 100 ROs per advisor monthly (NADA standard) so your metrics reflect real performance. You should prioritize repair order optimization to increase average hours sold per RO without compromising customer trust. Track hours sold per RO weekly, benchmark against targets, and flag advisors falling below threshold for coaching. Use transaction-level data to identify upsell opportunities and training gaps, then measure revenue enhancement from specific interventions. Present clear, customer-oriented goals on your Status TV so advisors and technicians see how their actions affect profitability and throughput. Consistent measurement lets you scale what works and correct what doesn’t.
Reduce One-Item ROs
While reducing one-item ROs may seem small, it’s one of the quickest levers you’ve got to raise hours sold per repair order and improve labor productivity; aim to analyze at least 100 ROs per advisor monthly, flag single-item visits, and set a clear target for increasing multi-service ROs. Track hours sold per RO weekly, measure percentage of one-item ROs, and set a realistic reduction goal. Use targeted upsell strategies tied to customer needs and transparent pricing to convert inspections into additional work. Standardize inspection techniques so advisors and techs consistently uncover service opportunities. Report conversion rate from inspection to added services and monitor revenue per RO. Reducing one-item ROs boosts labor efficiency, raises gross profit, and improves customer convenience.
Technician Productivity (Hours Billed Per Technician)
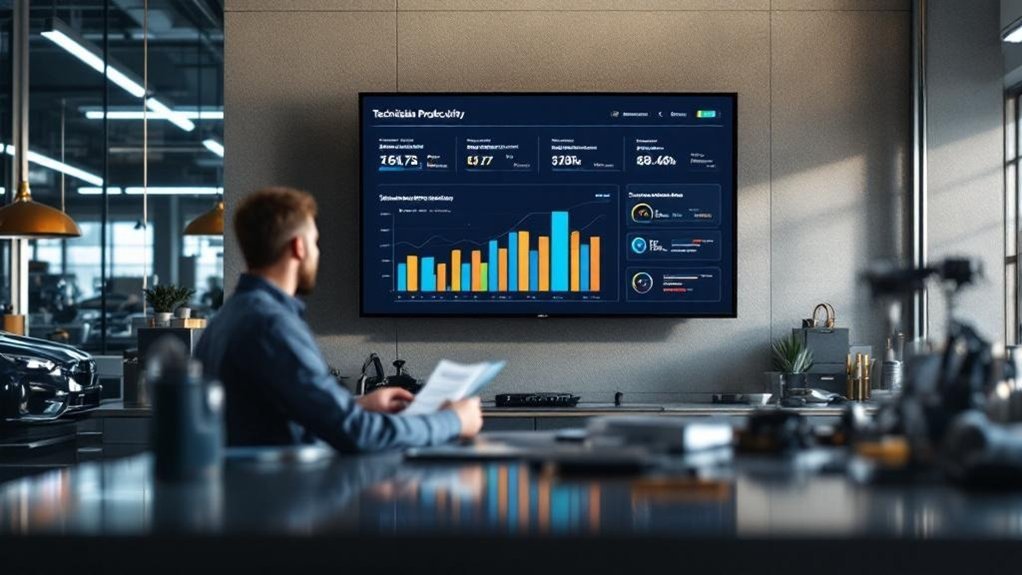
Track hours billed trends so you can spot rising or falling productivity and act before revenue slips. Compare utilization versus availability to see whether technicians are truly busy or just scheduled, and tie that to job mix impact to understand if complex jobs or quick services are driving results. Use these metrics to target training, balance workload, and push toward the 76% service gross profit benchmark.
Hours Billed Trends
Because hours billed per technician tie directly to revenue and capacity, you should monitor this metric closely to spot productivity shifts, training needs, and opportunities to increase labor utilization. Use billed hours analysis to compare monthly and weekly trends per tech, flagging deviations from benchmarks and expected outputs. Track technician performance against NADA’s guidance—review 100 repair orders per advisor monthly—to drive higher hours sold per RO and consistent productivity gains. Plot rolling averages to reveal slow declines or sudden spikes so you can diagnose causes: training gaps, uneven job mix, or scheduling issues. Regular, concise reporting lets you prioritize coaching, redistribute work, and implement targeted improvements that raise billed hours and boost dealership service revenue.
Utilization Versus Availability
Start by separating utilization (the share of paid time technicians spend on billable work) from availability (the total hours they’re on the clock), because confusing the two masks real productivity gaps; you need clear utilization metrics and availability analysis to manage performance. Track hours billed per technician by dividing total labor hours billed by tech count — that gives you an objective productivity baseline. Use these three action points:
- Set a 70% utilization target and display progress so you can drive technician engagement and minimize non-billable time.
- Monitor availability to spot scheduling or staffing inefficiencies that inflate paid-but-unproductive hours.
- Review trends weekly to identify training needs and link higher billed hours to revenue growth, keeping customer wait times and satisfaction in focus.
Job Mix Impact
One clear way to boost hours billed per technician is to manage job mix so each tech is working at the best combination of complexity and volume for their skill set; you’ll want to analyze repair orders by type and time-in-task to see which assignments raise billed hours without sacrificing effective labor rate or gross profit percent. Track hours billed per technician against benchmarks and review 100 repair orders per advisor monthly to spot patterns. Use job scheduling to align tasks with technician strengths, balancing quick-turn jobs and higher-value repairs to lift hours sold per repair order. Monitor effective labor rate and gross profit percent after adjustments to guarantee service diversity doesn’t dilute margins. Set targets, measure relentlessly, and adjust schedules.
Service Gross Profit Percentage
Service gross profit percentage shows you how much of every service dollar actually stays with the dealership by dividing service gross profit by total service revenue; a healthy benchmark is about 76%. You’ll track this KPI to see if service pricing strategies and technician performance metrics are delivering real margin, not just revenue.
- Monitor trends monthly to spot declines from rising parts/labor costs or inefficient technician performance metrics that erode margin.
- Improve percentage by adjusting service pricing strategies, optimizing labor rates, and reducing technician payouts while preserving quality and customer satisfaction.
- Use the metric to set targets, prioritize high-margin jobs, and measure the impact of process or staffing changes on profitability.
Report the percentage prominently so teams act on clear, measurable goals.
Repair Order Count and Cycle Time
After tracking gross profit percentage to verify your margins, you should measure repair order count and cycle time to see how many jobs you’re handling and how fast you’re completing them. The repair order count measures total service orders in a set period, revealing demand and allowing you to monitor repair order trends for peak days and staffing needs. Cycle time is the elapsed time from drop-off to pickup; target under 24 hours where possible. Use cycle time analysis to pinpoint bottlenecks—parts delays, technician allocation, or inefficient workflows—and correlate with order volume to prioritize fixes. Display these KPIs on your service TV to drive operational decisions, improve throughput, and deliver faster, more predictable customer experiences.
Customer Retention and Return Rate
Because loyal customers drive long-term profitability, you should track retention and return rate as core KPIs that show whether your shop’s service keeps customers coming back. You’ll monitor retention percentage against the 60% benchmark, watch drops after warranty expirations, and use customer feedback to spot service gaps quickly. Focus on actionable trends rather than anecdotes.
- Track retention rate monthly and compare to 60% target; correlate dips with operational changes and repair order trends.
- Measure return rate within 12 months per customer cohort; segment by warranty status and service type to prioritize outreach.
- Use loyalty programs plus targeted follow-ups based on feedback to raise satisfaction, increase return visits, and drive predictable revenue.
Appointment Show Rate and No-Show Percentage
Appointment show rate and no-show percentage tell you exactly how many scheduled customers actually come in and how many vanish without notice, and they should be tracked monthly against a roughly 60% show-rate target. You’ll monitor show rate and no-show% to spot trends, audit appointment-setting, and deploy no show strategies like confirmation calls and automated appointment reminders. Monthly analysis lets you quantify lost revenue and prioritize follow-up processes that lift engagement and productivity.
| Metric | Target | Action |
|---|---|---|
| Show Rate | ~60% | Use appointment reminders |
| No-Show % | Minimize | Apply no show strategies |
| Monthly Delta | +/- | Audit processes and adjust |
Frequently Asked Questions
What Are the 4 Key Performance Indicators for Customer Service?
The four key performance indicators are customer satisfaction, service efficiency (average repair time), customer retention rate, and appointment no-show rate; you’ll use these metrics to measure experience, speed, loyalty, and operational reliability.
What Is KPI in a Car Dealership?
Want to know what a KPI is? You’ll see KPI definitions: measurable dealership metrics that track performance (sales, service, satisfaction, profit). They’re direct, metric-focused tools you’ll use to improve customer outcomes and operational efficiency.
What Are the KPI for Repair and Maintenance?
You should track repair efficiency, hours sold per RO, effective labor rate, gross profit percent, maintenance costs, technician productivity, repeat repair rate, customer satisfaction/retention, average repair time, and warranty claim rate to drive metrics and improve customer experience.
What Are the KPIS for the Automotive Industry?
Picture a dashboard needle rising: you track Effective Labor Rate, Hours Sold/RO, Gross Profit %, Lead Conversion, Average Profit/Sale, and Customer Satisfaction. You’ll spot automotive trends, boost service efficiency, and keep customers returning.
Conclusion
Track these seven KPIs on your service-status TV and you’ll spot gains before they become obvious: when Effective Labor Rate rises, hours sold per RO usually follow; higher technician productivity coincides with better service gross profit; faster cycle times match higher RO counts and happier customers; improved appointment show rates sync with stronger retention. Focus on the metrics, act on the patterns, and you’ll keep customers returning and profits climbing—no guessing, just measurable wins.