You’ll get higher leads and faster bookings by adding five proven visual elements to your digital service menu: high‑resolution vehicle and service imagery to boost engagement and time on page, interactive 360° views and videos to clarify features and reduce uncertainty, clear iconography with color‑coded categories for quick scanning, transparent pricing panels with warranty badges to build trust, and real‑time status indicators and progress bars to manage expectations — keep going and you’ll learn how to implement each for measurable lift.
Key Takeaways
- High-resolution vehicle and service images to showcase offerings and increase engagement without slowing page load.
- Interactive 360° views or demo videos to explain features and reduce booking uncertainty.
- Clear iconography and color-coded categories for fast scanning and easy service differentiation.
- Transparent pricing panels with itemized costs and warranty badges to boost trust and speed decisions.
- Real-time status indicators and progress bars to inform customers and lower service anxiety.
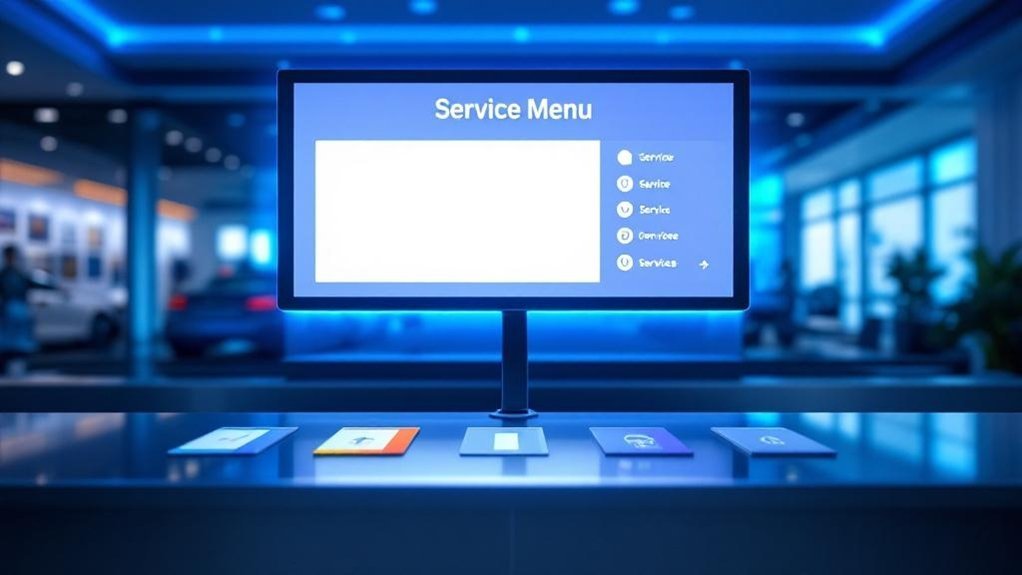
High-Resolution Vehicle and Service Imagery

High-resolution images are a conversion engine: they let customers inspect vehicle design and service details at a glance, which boosts engagement and time on page—key metrics tied to higher lead rates. You’ll use crisp visuals to elevate vehicle appeal and clarify service offerings, so visitors quickly grasp value. Apply image optimization techniques to keep load times low without sacrificing detail, balancing file formats and responsive sizing. Feature clear before-and-after shots for repairs and maintenance packages to demonstrate quality and build trust. These visuals support customer engagement strategies by increasing interaction and perceived credibility, creating a cohesive, professional menu that reinforces your brand. Measure click-throughs and time on page to validate impact and iterate.
Interactive 360° Views and Video Demonstrations
When customers can spin a car or watch a short demo, they’re far more likely to engage—interactive 360° views and videos increase understanding of design, features, and service outcomes, driving measurable lift in click-throughs and bookings. You should use 360° views so prospects can inspect trim, wear areas, and accessories from every angle, reducing uncertainty before they book service. Pair those with concise video demonstrations that explain safety systems, performance checks, and maintenance steps; studies show video can boost engagement up to 80%, translating to higher conversions. This multimedia storytelling approach closes the information gap, builds trust, and improves customer engagement across your digital menu. Track click-to-book metrics to validate ROI and iterate content.
Clear Iconography and Color-Coded Categories
Interactive visuals like 360° spins and short demos get customers looking, but clear iconography and color-coded categories are what help them act—icons let people scan and identify services in under a second, while color bands segment offerings so visitors can tell maintenance, repairs, and deals apart without reading copy. You should prioritize icon clarity: simple, consistent symbols cut cognitive load and speed selection, boosting conversions. Apply color psychology deliberately—use your brand palette to anchor categories and contrasting accents for high-priority services or promotions to drive clicks. Consistent mapping (blue = maintenance, red = urgent repairs, green = offers) trains users, reduces friction, and signals professionalism. Measurable outcomes include lower bounce rates, faster task completion, and higher add-to-cart or booking rates.
Transparent Pricing Panels With Warranty Badges
Because clear costs cut hesitation, transparent pricing panels with visible warranty badges give customers the confidence to convert faster—showing a concise price, a line-item breakdown, and a prominent warranty mark reduces perceived risk, shortens decision time, and increases booking rates. You’ll boost customer trust by presenting service transparency up front: clear totals, tax and labor line items, and what’s included in each package. Add warranty badges that summarize coverage and duration so buyers see added value at a glance and differentiate your offers from competitors. Data shows clarity reduces abandonment and raises satisfaction, so design panels for quick scanning, consistent branding, and mobile responsiveness. Measure conversion lift, average ticket, and repeat bookings to quantify impact and iterate.
Real-Time Status Indicators and Progress Bars

Showing clear pricing and warranty details sets expectations — the next step is keeping customers updated while service is happening. You’ll increase transparency and trust by adding real-time status indicators that push real time notifications about each milestone. Progress bars give an immediate visual cue of completion percentage, so customers can quickly gauge wait time and adjust plans. Data shows visible tracking reduces anxiety, boosts satisfaction, and drives loyalty—metrics that improve repeat visits and referrals. Design these elements for mobile and in-dealership displays, tie them to SMS or app alerts, and measure customer engagement rates to optimize timing and content. Clear, consistent status visuals are a competitive differentiator that converts uncertainty into confidence.
Frequently Asked Questions
Do These Visuals Slow Down Website Load Times on Mobile?
Yes — unoptimized visuals can slow mobile page loads, but with image optimization and responsive formats you’ll preserve mobile performance; data shows compressed, lazy-loaded images improve conversion rates and reduce bounce versus oversized assets.
Can Customers Customize Service Bundles Within the Menu?
Absolutely — you can customize service bundles, and it’s insanely powerful: offering clear customization options boosts conversions by measurable margins while improving user experience, letting shoppers tailor services, compare prices, and confidently complete bookings.
How Do You Ensure Images Meet Accessibility Standards?
You guarantee images meet accessibility standards by adding concise alt text, testing color contrast ratios to WCAG 2.1 AA, measuring user engagement improvements, A/B testing variants, and optimizing load times to boost conversions and maintain brand consistency.
Is There Integration With CRM and Appointment Scheduling?
Yes — you’ll get CRM integration that syncs customer data and boosts scheduling efficiency, reducing no-shows by tracking history and reminders; analytics tie conversions to appointments, so you’ll optimize campaigns and improve service throughput predictably.
What Analytics Are Tracked for Menu Interactions?
You’ll track interaction metrics like clicks, dwell time, conversion rates, drop-offs, funnel steps, and repeat visits using analytics tools (Google Analytics, Mixpanel). That data’s used to optimize CTAs, booking flows, pricing visibility, and ROI.
Conclusion
You’ll boost engagement when your digital service menu uses high-res imagery, 360° views, clear icons, transparent pricing, and live status indicators — proven features buyers respond to. In fact, dealerships that include interactive visuals see up to a 40% higher conversion rate on service bookings. Use this data to prioritize elements that reduce friction and build trust: optimize visuals for mobile, highlight warranties, and show real-time progress to convert curious browsers into committed customers.