
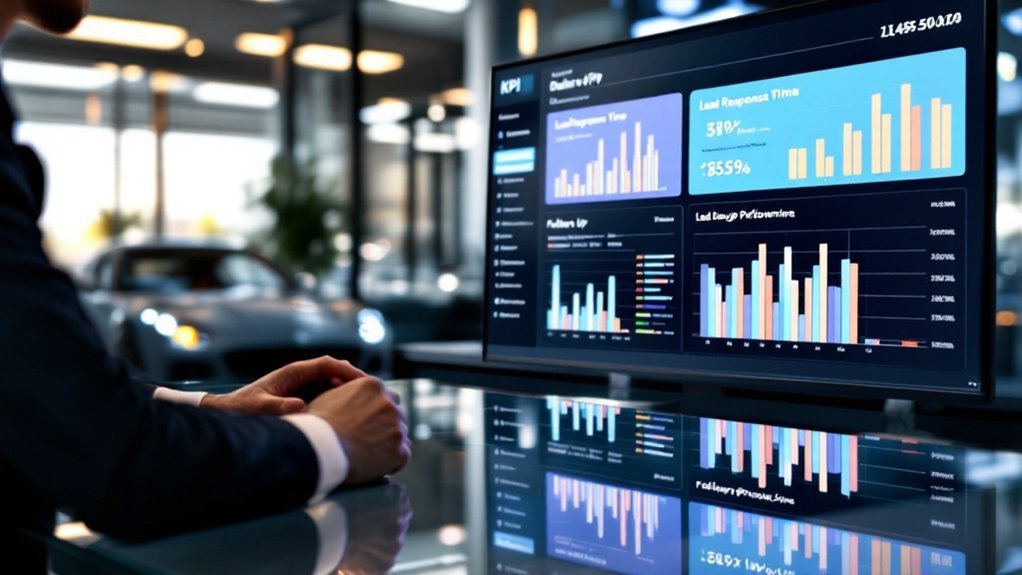
You need a real-time KPI dashboard that puts conversion, lead response time, inventory turns, GROI and service ARO front and center so you can drive revenue and hold teams accountable. Track units sold, conversion by channel and rep, lead speed under one hour, inventory turn (target ~12), used-to-new ratio (~1.25:1) and GROI ≥120%. Include alerts, drill-downs and rep-level benchmarks to act fast — more practical setup and targets follow.
Key Takeaways
- Display real-time sales KPIs: units sold, conversion rate, average transaction price, and gross return on investment (GROI).
- Highlight lead-response metrics: average response time, follow-up attempts logged, and conversion by channel and salesperson.
- Monitor inventory health: turn rate, used-to-new ratio, aging stock counts, and target turns (~12/year).
- Include service and retention KPIs: ARO, customer satisfaction score (CSS), retention rates, and after-sales revenue.
- Add alerts and drill-downs for deviations, channel performance, rep benchmarks, and recommended corrective actions.
Why a KPI Dashboard Matters for GSMs and Dealer Principals

Dashboards give you immediate visibility into the metrics that matter most — sales conversion, inventory turnover, average transaction price, and customer satisfaction — so you can make data-driven decisions in real time. You’ll use a KPI dashboard to monitor sales performance and dealership performance metrics against industry benchmarks, spotting underperforming segments fast. With clear key performance indicators on inventory turnover and average ticket, you can adjust sales strategies and pricing to protect margins and financial health. Real-time customer satisfaction scores let you intervene before issues cascade. Regular review creates accountability, aligns team goals, and converts insight into action plans that lift volume and service profitability. The result: focused execution, measurable improvement, and strategic control over dealership outcomes.
Essential Sales KPIs Every Dashboard Should Show
You need clear visibility into Units Sold trends to spot demand shifts and inventory gaps that affect revenue forecasting. Break down Conversion Rate by source, salesperson, and stage to pinpoint where leads are leaking and which tactics close deals. Together, those KPIs give you actionable signals to prioritize inventory, coaching, and marketing spend.
Units Sold Trends
Tracking Units Sold over time gives you a clear, quantitative view of market demand and sales effectiveness by showing how many vehicles were sold each day, week, or month and revealing seasonal patterns or the impact of specific initiatives. You use Units Sold as a core dealership KPI to benchmark sales performance, inform inventory management, and prioritize growth opportunities. A rising trend signals effective customer engagement and sales processes; a decline flags strategic adjustments. Combine Units Sold with sales conversion rate and other performance metrics to pinpoint gaps and wins.
- Compare Units Sold year-over-year to expose seasonality and demand shifts
- Segment by model, channel, and salesperson for targeted interventions
- Align inventory management to anticipated sell-through rates
- Track weekly cadence for timely tactical responses
Conversion Rate Breakdown
Although conversion rate (CVR) looks simple on the surface, it’s one of the most powerful levers for turning marketing spend and leads into revenue because it directly measures the percentage of qualified leads that become buyers. You should break down conversion rate by channel (website, walk-ins, campaigns) and by sales rep to pinpoint where lead generation converts best and where coaching is needed. Aim for 15–20% as a baseline; top performers exceed 25% by optimizing follow-up and customer experience. Use CVR trends to make data-driven decisions across dealership departments, adjusting marketing and training to arrest slowdowns. Monitoring CVR ties sales performance to financial performance, clarifies performance and success metrics, and elevates the sales team.
Lead Response Time and Follow-Up Performance Metrics
Because response time directly impacts conversions, your dealership needs to treat lead speed as a core KPI: with average online lead response at 12 hours 45 minutes versus top performers who reply in 62 seconds, you’ll see dramatically different conversion outcomes. You should track lead response time and follow-up performance as part of your performance metrics, using data-driven decisions to set targets (under one hour) and enforce lead assignment rules. Log every contact attempt in the CRM system so follow-up performance is measurable and persistent outreach is optimized. Use AI chatbots to handle off-hours lead engagement, then shift to reps during business hours to protect customer satisfaction.
Treat lead speed as a core KPI: respond under one hour, log every contact, and use chatbots off-hours.
- Average vs. top response benchmarks
- One-hour assignment rule
- CRM logging and persistence
- AI chatbots for off-hours
Conversion Rates by Channel and Sales Rep
You should compare channel-specific conversion rates—website, walk-ins, calls, referrals—to see which sources produce the highest yield per lead. Use rep-level CVR benchmarks to flag top performers and reps who need targeted coaching so you can allocate leads and training strategically. Track changes over time to quantify impact on revenue and adjust marketing spend accordingly.
Channel-Specific Conversion Tracking
Conversion tracking by channel gives you a clear, quantifiable view of which lead sources — website forms, walk-ins, outbound calls, and referrals — are actually turning into sales and which reps are making that happen. You’ll use channel-specific conversion tracking to tie conversion rates to revenue, sharpen marketing strategies, and streamline the sales process. By monitoring reps against channels you get actionable insights for coaching and resource allocation that boost dealership performance.
- Compare CVR by channel to prioritize high-return marketing strategies.
- Flag low-performing reps or times to deploy targeted training.
- Shift staffing to peak lead windows to protect conversion momentum.
- React quickly to sales slowdowns with process or campaign adjustments.
This approach keeps sales performance measurable, nimble, and revenue-focused.
Rep-Level Performance Benchmarks
Having channel-specific CVR data is only the start — to drive measurable improvement you need rep-level benchmarks that show how each salesperson converts by source. You’ll track conversion rates per rep across website leads, walk-ins, outbound calls, and referrals so you can identify areas for improvement and reward high performers. Use historical data and industry KPIs to set realistic targets that align with dealership performance goals. Regular reporting lets you spot declines early, adjust marketing strategies, and coach reps on tactics that boost customer retention and revenue. These benchmarks turn raw CVR into actionable insights, enabling data-driven decisions about staffing, training, and lead allocation to optimize overall sales performance and accountability among sales reps.
Inventory Turnover, Used-to-New Ratio and GROI

A tightly managed used-car program can make or break dealership profitability, so you’ll need to track inventory turnover, used-to-new ratio, and GROI as a coordinated trio of KPIs. You’ll target ~12 turns/year (top performers 16), turning inventory every ~20 days to drive sales performance and improve dealership performance. Maintain a used-to-new ratio near 1.25:1 to bolster dealership profitability. Insist on GROI minimum 120%, aiming for 160%+ by multiplying gross % by turns; monitor cost-to-market tightly.
- Track turns/month and annualized inventory turnover
- Monitor used-to-new ratio weekly against targets
- Calculate GROI per unit including acquisition/reconditioning/transport
- Flag slow stock and margin erosion for rapid action
These metrics tie inventory management to financial health and clear ROI decisions.
Service Department Profitability and After-Sales Revenue
Inventory and service are two sides of the same profitability coin: while used-car turns and GROI drive immediate cash and margin, the service lane secures recurring revenue and customer lifetime value. You need to track service department profitability tightly: ARO, service retention rates and after-sales revenue drive predictable cashflow and customer loyalty. Use CSS to quantify experience — lifting CSS raises retention and repeat spend. Monitor warranty claim rates to flag quality or process gaps that erode margins. Align targets to dealership performance and overall financial health: increase ARO via value pricing/up-selling, improve CSS through tech training, reduce warranty claims with quality checks.
| Metric | Target | Action |
|---|---|---|
| ARO | $X | Upsell + pricing |
| CSS | 90% | Training + follow-up |
| Retention | 65% | Loyalty programs |
Digital Engagement: Social Media and Email KPIs

When you track social and email KPIs together, you get a clear, actionable view of how digital engagement drives showroom visits and service bookings. You’ll measure social media post frequency, community interaction, and website traffic from social channels to quantify lead generation and customer engagement. Email marketing metrics — open rates, click-through rates, replies and delivery issues — tell you campaign effectiveness and touchpoints that convert.
- Monitor social engagement and referral website traffic to prioritize high-intent content
- Track email open/click trends and spam rates to fix delivery and boost campaign effectiveness
- Use user feedback on social channels to tailor offers and improve conversion rates
- Tie leads from digital marketing to showroom visits and sales for accurate KPIs
Real-Time Reporting, Alerts and Data Visualization Best Practices
Because timely insights drive faster decisions, real-time reporting gives you immediate visibility into sales performance and operational bottlenecks so you can act before small issues escalate. Use dashboards that surface key performance indicators (KPIs) with clear data visualization—simple charts, color-coded thresholds, and drill-downs—to turn complex data into actionable insights. Configure alerts for significant KPI deviations so management can respond to risks and adjust sales strategies proactively. Embed drill-down paths so you can trace root causes quickly and quantify impact on dealership performance. Regularly solicit user feedback and update dashboard layouts and alert parameters to keep metrics relevant as conditions change. This keeps your reporting lean, decision-ready, and tied directly to measurable outcomes.
Setting Targets, Benchmarks and Continuous Improvement Plans

Real-time dashboards give you the facts; targets and benchmarks tell you what to do with them. You’ll use real-time data analytics to set targets aligned to dealership performance goals: a used-to-new ratio near 1:1, inventory turn rate of 12, and GROI ≥120%. Monitor performance metrics like sales conversion rates and customer satisfaction to drive continuous improvement.
- Define clear benchmarks and incremental targets for each KPI using historical and market data.
- Use dashboards to compare real-time results to benchmarks and trigger corrective actions when trends deviate.
- Review sales conversion rates and inventory turn rate weekly; adjust pricing, merchandising, or staffing.
- Communicate progress and accountability to the team, linking rewards to measurable improvements in gross return on investment.
This keeps improvement systematic and measurable.
Frequently Asked Questions
What Is the Best KPI for Sales?
Sales conversion is the best KPI, since it ties lead generation to customer retention and average transaction values, while informing inventory turnover, profit margin, sales forecasting, employee productivity and market penetration for strategic, data-driven decisions.
What Is a Dealer Dashboard?
Like a cockpit, a dealer dashboard shows real time analytics and key metrics visualizations so you can track sales performance, make data driven decisions, use dashboard software options, follow dashboard design tips, create customizable reports with user friendly interfaces.
How to Measure Dealer Performance?
You measure dealer performance metrics by tracking sales conversion rates, customer satisfaction scores, inventory turnover ratio, lead response time, sales training effectiveness, employee engagement levels, market share analysis and profit margin tracking, turning data into strategic action.
What Are the KPIS for the Automotive Industry?
You should track sales conversion, customer retention, inventory turnover, gross profit, market share, lead response, service efficiency, upsell rates, and sales growth to measure performance, prioritize data, set targets, and drive strategic improvements.
Conclusion
You’re the one steering performance — treat the dashboard like a pit crew radio. I once watched a GSM fix a 10% drop in conversions by spotting a stalled lead source in real time; within a week they reclaimed 6% market share. Use that same urgency: track response time, conversion by channel, GROI and service profit, set clear targets, and sprint on gaps. Data-driven alerts turn hindsight into immediate wins.