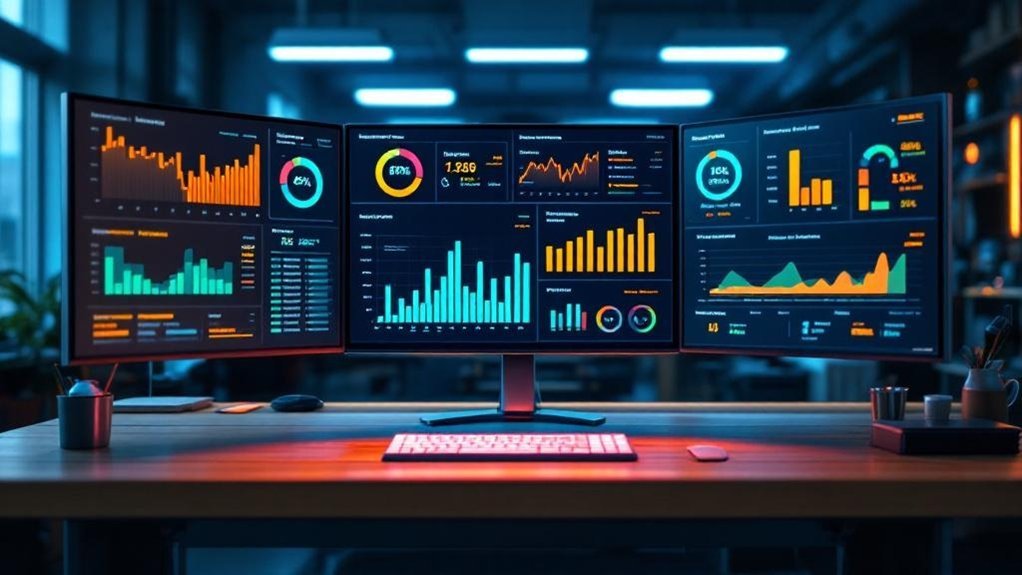
You need a centralized fixed-ops dashboard that pulls DMS data from every rooftop and updates in near real time so you can spot workload imbalances, track ROs, and measure technician efficiency across stores. Monitor RO volume, average RO value, effective labor rate, tech efficiency, OP-code saturation and CSI to drive staffing, parts allocation, and training. Use leaderboards and alerts for accountability, and AI-backed reports for strategic labor and margin moves — continue for implementation and ROI details.
Key Takeaways
- Centralize real-time DMS data across rooftops to monitor ROs, hours, and technician efficiency every 15 minutes.
- Compare KPIs like hours per RO, effective labor rate, and CSI to drive staffing and profitability decisions.
- Use leaderboards and mobile access to motivate technicians and advisors with goal-driven, cross-store competition.
- Configure alerts and AI-driven trend detection to preempt capacity gaps and flag underperforming shops.
- Standardize onboarding, training, and weekly audits to ensure data accuracy and measurable ROI across locations.
Why a Centralized Fixed Ops Dashboard Matters for Multi-Store Groups

When you manage multiple service locations, a centralized Fixed Ops dashboard gives you real-time visibility into key performance metrics across every store so you can spot workload imbalances, track repair orders and technician efficiency, and act on opportunities before they become problems. You’ll consolidate disparate data to benchmark stores, improving operational efficiency by reallocating labor and parts where demand spikes. With unified reporting, you can forecast marketing opportunities from high-performing shops and standardize processes to lift customer satisfaction across the portfolio. The dashboard streamlines interdepartmental communication, enforces accountability through tracked KPIs like repair orders and labor rates, and surfaces trends via advanced analytics. That lets you make proactive, data-driven decisions that boost productivity, profitability, and retention.
Key KPIs Every Service Director Should Monitor Across Locations
Start with a focused set of KPIs—ROs, Technician Efficiency, Effective Labor Rate, CSI, and OP-code Saturation—to give you a clear, comparable view of performance across every location. Monitor Repair Orders volume and average RO value to spot demand shifts and revenue gaps. Track Technician Efficiency by job time versus standard time to identify coaching needs and balance workload. Analyze Effective Labor Rate to guarantee labor pricing aligns with market and maximizes per-hour revenue; segment by store for targeted margin improvements. Use Customer Satisfaction Index trends to detect service quality issues and correlate CSI with repeat visits and warranty claims. Finally, measure OP-code Saturation to confirm consistent service mix utilization and uncover cross-sell opportunities across the portfolio.
Real-Time Technician Performance Tracking and Goal Management

You’ll get live Tech Efficiency metrics streaming every 15 minutes so you can spot underperformance and adjust staffing or workflows immediately. Use goal-based hour tracking to measure progress against targets and drive accountability across technicians and locations. OP-code performance alerts flag recurring issues by job type so you can prioritize coaching and optimize profitability.
Live Tech Efficiency Metrics
Track technician performance in near real-time with data that updates every 15 minutes, giving you immediate visibility into Tech Efficiency, Effective Labor Rate, and hours worked so you can spot productivity gaps, recognize high performers, and adjust goals quickly. You’ll get real-time updates on technician performance that surface actionable insights for staffing, training, and incentive decisions. Use unlimited customized reports and DMS-integrated data to benchmark efficiency across stores, compare Effective Labor Rates, and monitor hours distribution by skill set. Dashboards highlight outliers, trend shifts, and capacity constraints so you can prioritize interventions or rewards. With concise, reliable metrics refreshed every quarter hour, you can make strategic, evidence-based choices to lift productivity and align technician output with dealership objectives.
Goal-Based Hour Tracking
A live Goal-Based Hour Tracking dashboard gives you real-time visibility into each technician’s Tech Efficiency, Effective Labor Rate, and hours worked versus personalized targets, updating every 15 minutes so managers can coach, reassign, or reward with minimal lag. You’ll use goal-based hour tracking to compare actual hours to targets, flag under- or over-delivery, and prioritize coaching for technicians whose metrics diverge from expectations. Integrated DMS leaderboards surface technician performance across stores, driving accountable, data-driven competition. Customizable reports let you set individual goals, track progress, and export trends for weekly reviews. With workload disparity detection and schedule optimization, you’ll balance capacity, reduce idle time, and increase billable hours—protecting margin and boosting service department productivity and profitability.
OP-Code Performance Alerts
OP-Code Performance Alerts give you real-time visibility into each technician’s output—hours, efficiency, and effective labor rates—across all stores with updates every 15 minutes so you can quickly reassign work, coach underperformers, or capitalize on high performers. Using op-code performance alerts and real-time tracking, you’ll monitor OP-Code saturation and pinpoint where technician performance lags or excels. Set specific, measurable goals for hours and efficiency, then watch live reports on any device to validate progress and adjust resource allocation. Alerts flag deviations from targets so you can deploy training, rebalance workloads, or reward top contributors. The result: tighter operational control, faster corrective actions, and measurable gains in productivity and revenue across your fixed ops network.
Measuring Service Advisor Success: Sales, Appointments, and CSI
You’ll measure advisor impact by tracking sales per repair order to quantify upsell effectiveness and revenue contribution. Monitor appointment conversion rate to see how well advisors turn inquiries into booked and completed work. Tie CSI to retention metrics so you can prioritize coaching that boosts repeat business and lifetime value.
Sales per Repair Order
When service advisors boost Sales per Repair Order, they’re directly increasing average revenue per transaction while revealing how well they convert appointments into value-added services; tracking this KPI across stores lets you pinpoint top performers, benchmark outcomes, and target coaching where upsell rates or appointment conversion lag. Use Sales per Repair Order to quantify advisor effectiveness: higher values signal consistent, consultative selling and stronger CSI ties. Monitor service advisors with real-time performance tracking, comparing rolling averages and variance by location to spot outliers fast. Link Sales per RO to training initiatives and incentive plans, then measure lift. Report trends weekly and monthly, correlate with CSI for quality validation, and deploy focused coaching where Sales per RO deviates from benchmarks.
Appointment Conversion Rate
Appointment Conversion Rate measures the share of scheduled service appointments that turn into actual repair orders, giving you a clear, numeric read on how effectively advisors convert interest into revenue; high performers often post conversion rates above 30–40%, and those gains usually track with stronger CSI and repeat business. You’ll use appointment conversion rate as a primary KPI to rank advisors, target coaching, and allocate resources across service departments. Real-time dashboards let you spot underperformers and replicate successful behaviors from top converters. Correlate conversion data with customer satisfaction index to guarantee higher conversion isn’t sacrificing experience. Across multiple stores, comparative views foster constructive competition and standardized best practices, driving higher revenue per bay, improved advisor skill, and consistent, measurable service department performance.
CSI Impact on Retention
Having strong appointment conversion is only part of the story — CSI directly drives whether those converted visits turn into repeat customers. You should track CSI alongside sales and appointment counts to quantify advisor effectiveness: higher CSI correlates with increased customer retention and repeat business. Use real-time dashboards to flag declining CSI trends so you can coach advisors, adjust processes, and resolve issues before churn occurs. Cross-reference CSI with individual advisor sales and appointment metrics to identify best practices and skills gaps. Embedding CSI into service operations KPIs creates accountability and speeds response to feedback, improving experience and referrals. Ultimately, sustained CSI improvement boosts retention, enhances reputation, and generates new customer acquisition through positive word-of-mouth.
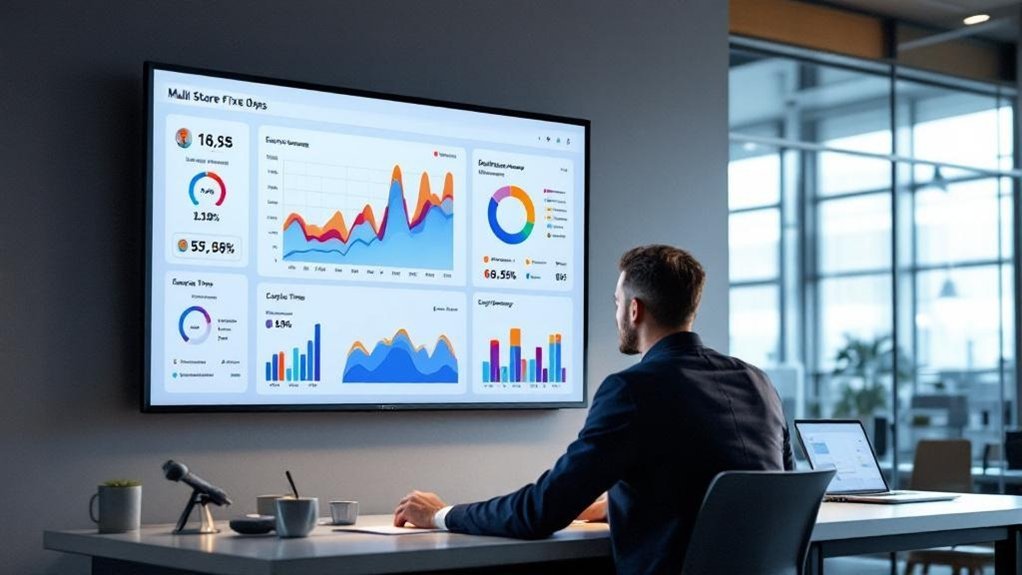
Integrating DMS Data: Seamless Multi-Rooftop Reporting

Because your DMS data feeds directly into a multi-store fixed ops dashboard that refreshes every 15 minutes, you get centralized, real-time visibility across rooftops to track ROs, hours worked, and technician efficiency for faster, more informed decisions. You’ll consolidate multiple DMS platforms into one authoritative source, ensuring consistent, real time metrics across locations. That centralized feed lets you generate customizable reports to compare productivity and allocate labor where it moves KPIs most efficiently. With automated updates, you can intervene quickly on underperforming shops, balance technician hours, and optimize parts availability. The result: streamlined communication between service departments, improved operational consistency, and measurable lifts in customer experiences and revenue potential across your rooftop network.
Using Mobile and TV Leaderboards to Drive Engagement and Accountability
You’ll get real-time team visibility via mobile and TV leaderboards that surface ROs, hours, efficiency, and sales every 15 minutes so you can spot trends and outliers instantly. Use goal-driven, friendly competition to raise productivity—rankings and customized KPI cards make targets clear and motivate staff to improve. With live insights on any device, you can provide timely feedback and coach teams toward measurable gains.
Real-time Team Visibility
When service directors need instant insight, real-time mobile and TV leaderboards deliver up-to-the-minute KPIs—sales, hours, efficiency, and customer satisfaction—updated every 15 minutes so teams can act on fresh data; these cross-platform leaderboards drive friendly competition among advisors and technicians, boost accountability, and let directors create unlimited customized reports to target improvement across multiple stores. You’ll use these leaderboards to monitor performance trends, spot declines, and allocate resources quickly. Mobile access keeps field staff aligned; TV displays make metrics visible during shifts. Automated 15-minute refreshes reduce reporting lag, so interventions are timely and data-driven. Custom reports let you isolate stores, roles, or KPIs to assign corrective actions and measure accountability outcomes.
Goal-driven Friendly Competition
If you want teams to hit targets consistently, goal-driven mobile and TV leaderboards turn KPIs into visible, measurable incentives that spur friendly competition across stores; by revitalizing every 15 minutes and surfacing sales, ROs, and efficiency rates, they let advisors and techs see exactly where they stand against goals and peers, drive short-term adjustments, and make accountability tangible. You’ll use goal-driven insights to set clear objectives, then broadcast customizable reports that highlight individual and store-wide achievements. Mobile access keeps performance metrics in technicians’ pockets, enabling on-the-go course corrections. The result is a measurable uplift: faster feedback loops, increased engagement, and transparent comparisons that promote healthy rivalry. As a service director, you’ll quantify impact and scale best practices across locations.
Custom Reports and AI Insights for Strategic Decision-Making
Because you need a clear, unified view across locations, custom reports and AI insights on a multi-store fixed ops dashboard give service directors a concise, data-driven platform to spot trends, compare KPIs like hours per RO, effective labor rate and CSI, and take strategic action—whether reallocating techs, prioritizing warranty vs. customer-pay work, or forecasting demand to boost revenue and profitability. You’ll use custom reports and AI insights for strategic decision-making that tightens operations and raises accountability.
- Consolidated KPIs across stores for rapid comparison
- AI-driven trend detection to preempt capacity gaps
- Tailored warranty vs. customer-pay breakdowns for margin control
- Real-time alerts on hours per RO and effective labor rate
- Forecasts to align staffing and parts inventory with demand
Digital Signage and In-Store Displays to Reinforce Performance Culture
Although visual cues alone won’t fix process issues, digital signage and in-store displays give you a concise, data-driven way to keep KPI performance front and center—showing real-time ROs, efficiency, effective labor rate and CSI across screens to drive accountability and friendly competition. You’ll deploy managed digital signage with 99.999% uptime so performance metrics are continuously visible, reinforcing a performance-oriented culture. Stack customizable reports into single displays to highlight store-specific KPIs and promote transparency. Live performance reports around the shop foster friendly competition, increasing technician and advisor productivity. Mobile app access guarantees you can view real-time data and intervene remotely when trends slip. Use displays strategically to normalize daily targets, spotlight wins, and align teams to measurable goals without replacing core process improvements.
Implementation Best Practices and Rapid Onboarding Across Multiple Sites
Having live KPIs on shop screens sets the stage, but real value comes from rolling the dashboard out across sites with speed and consistency. You’ll prioritize seamless implementation with DMS integration to guarantee accurate, real-time performance tracking across locations. Aim for a repeatable, low-friction onboarding path so sites go live in days, not weeks.
- Standardize HDMI/WiFi setup instructions for rapid onboarding
- Pre-configure KPI templates but allow store-specific customization
- Train core users with concise modules and on-demand support
- Monitor adoption using live reports on TVs and mobiles
- Run weekly audits to catch data or connectivity issues
This approach reduces variability, accelerates insights, and makes centralized oversight scalable and actionable.
Evaluating ROI: How Dashboards Improve Profitability and Retention
When you measure the right KPIs in real time, dashboards turn visibility into profit by revealing where labor, throughput, and retention are leaking value. You’ll track hours per RO and effective labor rate across sites, spotting a 30% uplift opportunity by standardizing processes and technician workflow. Predictive analytics help you forecast demand, staff efficiently, and avoid overtime waste. That improves utilization and customer satisfaction, driving repeat business. Dashboards also expose advisor performance so targeted training boosts retention and lowers hiring costs. Quantify ROI by comparing reduced turnover, higher throughput, and increased retention against dashboard investment; payback periods often shrink as you scale.
| Impact | Emotion |
|---|---|
| +30% hours per RO | Confidence |
| Lower turnover | Relief |
| Higher satisfaction | Trust |
| Forecast accuracy | Control |
| Faster payback | Satisfaction |
Frequently Asked Questions
How Does the Dashboard Handle Data From Franchise vs. Corporate-Owned Stores?
You’ll see franchise data integration and corporate insights comparison side-by-side, so you can run performance metrics analysis across ownership types, filter by store category, and act on strategic gaps identified through normalized, comparable data.
Can the System Support Multiple Currencies and Tax Rules Across Regions?
Yes — it supports multiple currencies, multiple tax regimes, multiple pricing strategies: you’ll get currency conversion options, tax compliance features, regional pricing strategies, automated reporting, configurable rules, and centralized controls for accurate, auditable, strategic financials.
What Training Resources Exist for Non-Technical Store Managers?
You’ll get guided onboarding, bite-sized training video formats, role-specific workshops and cheat sheets; we track user engagement strategies and collect user feedback mechanisms for iterative improvements, so training’s measurable, strategic, and tailored to non-technical store managers.
How Is Historical Data Archived and Accessed for Long-Term Analysis?
You’ll be ecstatic to learn historical data’s archived via tiered storage and cold archives: you’ll follow data retention policies, use archival technologies like object storage and tape, and query extracts or OLAP marts for long term analysis.
What Uptime SLA and Disaster Recovery Options Are Provided?
We guarantee 99.9% uptime guarantees, with documented recovery procedures and tiered disaster recovery options (RTO/RPO targets). You’ll see service availability metrics, automated failover, backups, and periodic DR drills to validate recovery performance.
Conclusion
You need a centralized fixed‑ops dashboard to turn multi‑store data into action. With real‑time KPls, you’ll spot that shops using unified dashboards report 12% higher labor utilization and 8% greater retention — showing small visibility gains compound fast. Track tech productivity, advisor sales, CSI and DMS-integrated trends, then use AI reports and digital signage to drive consistency. Roll out with fast onboarding templates and measure ROI by margin uplift and reduced cycle times.