
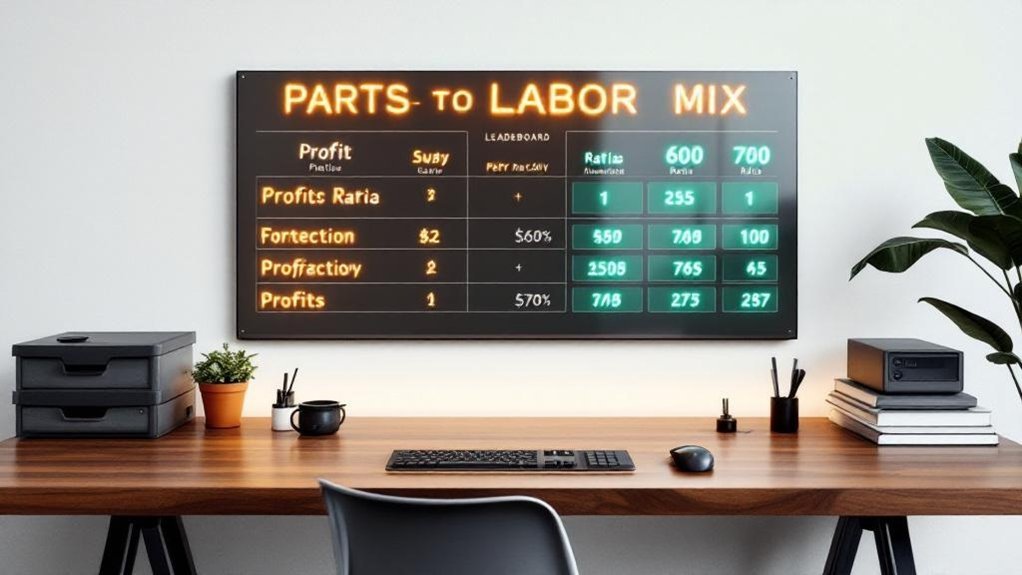
You need a parts-to-labor leaderboard that ties mix to profit so you can benchmark performance and prioritize pricing, labor matrix, and KPI fixes. Compare your current ratio to the 0.66:1 target and 60% parts gross margin, track monthly trends, and flag shops that hit labor GP ≥75%. Focus on parts pricing, time multipliers, and technician scheduling to shift toward a 60/40 mix. Continue for step‑by‑step tactics and case examples that drive results.
Key Takeaways
- Rank shops by parts:labour ratio versus 0.66:1 target, flagging top and bottom performers monthly.
- Include a profitability callout linking each shop’s ratio to net profit percentage change.
- Show parts and labour gross margins separately (target: parts 60%, labour ≥75%) for clarity.
- Highlight specific pricing or labour-matrix actions that moved metrics, with expected profit impact.
- Provide weekly trend arrows and recommended corrective steps for shops diverging from targets.
Why the Parts:Labour Ratio Matters Now
Because vehicle repairs now demand more diagnostic time and specialized labour, the parts:labour mix has moved from a historical 1:1 toward a recommended 0.66:1, and that shift matters to your bottom line: it shows that profit growth will increasingly hinge on selling and pricing labour effectively rather than relying on parts margins alone. You’ll need to monitor your parts:labour ratio as a KPI, since a target near 0.67:1 signals healthier service-focused revenue. Analyze how variations affect profit margins and model scenarios where a higher labour rate offsets weaker parts returns. Adjust your parts pricing matrix to protect margins without undercutting labour demand. Tactical steps include tracking technician productivity, refining labour rate tiers, and updating service menus so pricing and sales mix align with evolving repair complexity.
Benchmarking Your Shop Against the Leaderboard
Start by comparing your current parts-to-labor ratio against the recommended 0.66:1 target and the leaderboard’s top performers to pinpoint gaps. Quantify how aligning with a ~60% parts gross margin and a 0.67:1 KPI would impact overall profitability under rising labor rates. Then establish specific pricing and labor-rate adjustments to close shortfalls and track progress with monthly KPI reviews.
Parts-to-Labor Ratio
When you benchmark your shop’s parts-to-labor ratio against the leaderboard, you’ll see that the industry has shifted toward a 0.66:1 target, reflecting a deliberate move to emphasize labor sales for profitability. You should analyze historical declines from 1:1 to 0.8:1 to understand competitive pressures and overhead impacts. Track parts margins and labor rate by job to confirm parts gross profit margin near 60% while keeping labor gross profit above 75%. Use a structured pricing matrix to adjust markup tiers, labor rate bands, and parts sourcing decisions. Regularly compare your parts-to-labor ratio to the leaderboard to pinpoint imbalances, prioritize corrective actions, and align mix with industry benchmarks for sustained financial optimization.
Profitability Benchmarks
Having benchmarked your parts-to-labor mix against the leaderboard and identified where your shop sits relative to the 0.66–0.8:1 range, now quantify profitability targets to see how mix and margins interact. You should target a labor margin ~70% and parts margin 50% while driving parts sales to hit a 0.8:1 ratio. Use a pricing matrix to enforce consistency — a 2.5 multiplier on cost commonly yields ~60% GPM on parts. Track adherence, adjust for customer perception and competition, and model scenarios where parts profitability slips. Regular audits and clear pricing rules prevent margin erosion. Below is a quick reference to compare targets and outcomes.
| Metric | Target |
|---|---|
| Labor margin | 70% |
| Parts margin | 50% |
| Parts GPM | 60% |
| Multiplier | 2.5 |
How to Calculate and Track Your Parts:Labour Mix

Start by calculating your parts:labour ratio—divide total parts sales by total labour sales and compare the result to the target ~0.66:1 (60/40) to see where you stand. Then track that ratio monthly to spot trends, seasonal shifts, or the impact of pricing and labor rate changes. Use those monthly trends to adjust your parts pricing matrix and labour rates strategically, keeping profitability and customer transparency aligned.
Calculate Parts:Labour Ratio
Because your parts-to-labour mix directly affects margins and pricing strategy, you’ll want to calculate it by dividing total parts sales by total labour sales and aim for the industry-recommended 0.66:1 (roughly 60% parts to 40% labour); for example, $66,000 in parts against $100,000 in labour yields 0.66:1. Calculate monthly or per job totals, record parts and labour line items separately, then compute the ratio: parts ÷ labour. Use that ratio to test pricing assumptions and forecast profit impacts as diagnostic-driven labour grows. If parts margins compress, a stronger labour mix can preserve overall profit. Implement a labour matrix to refine hourly rates and allocations so the ratio aligns with your profitability targets and operational realities without guesswork.
Track Monthly Trends
How will you know if pricing or workflow changes are working unless you track the parts:labour mix month to month? You’ll calculate the ratio by dividing total parts sales by total labour sales and log that result each month, aiming for about 0.66:1 (60/40) to optimize profitability. Establish a structured reporting cadence to track monthly trends, recording totals, variance, and contextual notes (promotions, seasonal work, staffing). Regularly benchmark against KPIs and industry norms, flagging deviations beyond set thresholds. Use a labor matrix to adjust times and rates systematically for complex jobs, then re-run the mix to measure impact. This disciplined, analytical loop—measure, analyze, adjust—lets you make targeted pricing and workflow decisions that protect margins.
Profitability Callouts: What to Watch For
Wondering which financial levers you should monitor first? You’ll want to track parts profit and labor gross profit independently and together to spot margin erosion. Aim for labor gross profit at or above 75% and parts retail near 60%; deviations signal immediate action. Watch mix shifts toward parts — a rising ratio can hide weak labor margins and reduce overall profitability. Monitor adherence to pricing strategies via a Parts Pricing Matrix to sustain a 45% margin target on certain SKUs and lift monthly revenue. Flag frequent discounts or inconsistent markup application; they’re early indicators of discipline breakdown. Finally, measure customer feedback alongside margin metrics so pricing integrity doesn’t undermine trust or long-term retention.
Strategies to Shift Toward a 60/40 Mix

If you want to shift toward a 60/40 parts-to-labor mix, start by treating labor as a strategic product—price it to reflect diagnostic complexity and technician skill while tightening parts margin controls so neither side cannibalizes the other. You’ll need to audit current jobs to quantify labor-heavy repairs and identify service lines where diagnostic time drives value. Adjust technician scheduling to maximize productive labor hours and train advisors to sell labor-driven solutions confidently. Implement targeted upsells for complex repair packages and warranty-backed services to lock in labor revenue. Monitor parts-to-labor KPIs weekly, tying compensation to labor productivity and repair accuracy rather than parts volume. These steps help protect margins and shift your profitability toward sustainable labor growth.
Implementing a Parts Pricing Matrix for Higher Margins
Because margins hinge on consistent markup, implementing a parts pricing matrix gives you a precise, scalable way to hit target GPMs: multiply part cost by a variable factor (e.g., 3–3.5 on low-cost items, ~2.5 for mid-range, ~1.75 for high-cost) and enforce those tiers across your inventory so every SKU contributes predictably to profit goals. You’ll set a baseline pricing strategies framework that targets a gross profit margin near 60% by applying a 2.5 multiplier on mid-range parts (a $60 part becomes $150). Track adherence by SKU and run variance reports to catch deviations. Use management systems to upload matrix rules, automate pricing updates, and generate dashboards. Consistency is the control lever: without it, profitability slips and revenue opportunities get missed.
Designing and Applying a Labor Matrix

You’ll build a labor matrix that uses clear multipliers on standard labor times to capture complexity and protect margins. Factor in vehicle age and condition as adjustment layers so older or worn vehicles trigger higher multipliers or added diagnostic time. Regularly test those multipliers against actual job times to fine-tune billing accuracy and maximize profitability.
Labor Time Multipliers
Although tailoring a labor matrix takes upfront analysis, it’s one of the most effective levers you’ll have to align quoted hours with real shop conditions and profit goals. You’ll design time multipliers that scale quoted hours by job complexity bands, ensuring service writers enter repair orders that reflect expected effort and support target profit margins. Set ranges where multipliers increase for extensive jobs so labor recovers technician time and variability. Calibrate multipliers to your labor rate and desired 75%+ gross profit on labor, and customize per shop specialties. Monitor outcomes: compare quoted vs. actual hours, adjust multipliers, and retrain service writers on application. Continual iteration keeps pricing accurate, margins protected, and customer communication transparent.
Age & Condition Adjustments
When a vehicle’s age or condition increases the likelihood of hidden labor or safety-driven disassembly, adjust your labor matrix with explicit age/condition bands so quoted hours match expected technician effort and shop risk. You’ll set clear multipliers for categories—young/clean, aged/high-mileage, and salvage/poor-condition—so estimates reflect additional diagnostics, corrosion removal, or part cascades. Apply predetermined multipliers to standard times, then validate against closed-job data monthly to guarantee adjustments preserve profitability. Tailor bands to your labor rates and service mix; what boosts revenue at one auto repair shop may underprice another. Communicate changes to technicians and front-desk staff, track billed hours growth, and iterate the matrix to balance competitive pricing, technician pay, and sustainable margins.
Training Your Team to Protect Labor and Parts Profit
Start by delivering regular, targeted training that ties everyday actions to the shop’s parts-to-labor ratio and overall profitability so your team clearly understands why hitting a 0.66:1 parts-to-labor mix matters. You’ll teach technicians and service writers to communicate labor value confidently, supporting higher labor rates (targeting ~$165/hr) to offset squeezed parts margins. Create a structured parts pricing matrix with cost-based multipliers to standardize gross margins near 60%. Use sessions to link technician performance to labor gross profit goals (aim ≥75%), showing how time management and upsell accuracy drive results. Reinforce accountability through recognition and documented expectations to lower turnover and preserve institutional skills. Measure progress through focused coaching, corrective action plans, and frequent role-specific refreshers.
KPIs to Monitor for Sustainable Shop Growth

Several measurable KPIs should be tracked weekly to keep your shop growing sustainably, with the parts-to-labor ratio (target 0.66:1) front and center because it directly ties to revenue mix and margin stability. Monitor labor gross profit margin (aim ≥75%), parts sales gross margin (target 60%), and absolute parts and labor revenue to detect mix drift. Track average parts prices and markup multiples against cost; enforce a pricing matrix so high-value parts hit desired multipliers (e.g., 2.5×) to protect margins. Measure job-level profitability, technician efficiency, and parts fill rates to link operational performance to financial outcomes. Report metrics in dashboards for shop owners, set corrective actions when KPIs slip, and review trends weekly to sustain growth.
Case Studies: Shops That Improved Their Mix
The KPIs you just reviewed tell you what to watch; what follows shows how real shops changed behavior and results. You’ll see targeted interventions: Shop A shifted its parts-to-labor mix from 0.8:1 to 0.66:1 by prioritizing labor-intensive diagnostics, driving a 15% profitability lift in six months. Shop B deployed a parts matrix to standardize pricing, boosting parts margins from 40% to 60% and adding $78,000 in annual sales. Shop C raised labor rates from $100 to $130 while trimming parts prices, improving customer acceptance and lifting labor gross profit by 10%. Shop D’s labor matrix improved time estimates, increasing labor gross profit from 68% to 75%. Shop E cut discounts 20% via stronger customer relationships, preserving margins across parts and labor.
Frequently Asked Questions
What Is a Good Parts to Labor Ratio?
A good parts to labor ratio is about 0.67:1, so you’ll target the ideal ratios used in industry standards; you’ll focus on improving efficiency and tracking performance to boost labor sales and sustain profitability.
What Is a Labor Matrix?
A labor matrix is a structured tool that lets you adjust billed hours using multipliers to boost labor efficiency, inform cost management, track performance metrics, and drive workforce optimization so you can strategically maximize profitability and consistency.
How to Build a Labor Matrix?
You build a labor matrix by conducting labor cost analysis, defining tiered multipliers, mapping repair complexity, implementing efficiency tracking, measuring employee productivity, adjusting rates for service optimization, and continuously reviewing data to refine strategic pricing and staffing.
What Is the Parts Matrix in Auto Repair Shop?
A parts matrix is a structured pricing tool setting markups to reach target margins; you’ll align parts pricing strategies with labor cost analysis, use inventory management techniques, and measure customer service impact to keep pricing consistent and profitable.
Conclusion
You’re closing the loop: improving your parts-to-labor mix isn’t guesswork but a measurable strategy that protects margins. Focus on a 60/40 target, track mix by job, and enforce a labor matrix so technicians get paid for true value. For example, a mid-sized shop in Ohio shifted pricing and training, moved from 70/30 to 62/38 in nine months, and lifted net profit 4.5%. Keep monitoring KPIs and adjust tactics to lock in sustainable gains.