You need a leaderboard that quantifies appointments, demos, and write-ups with weighted points, real-time CRM/calendar sync, and simple progress bars so reps see clear priorities and managers spot gaps. Track appointments to measure outreach, demos to assess interest, and write-ups to preserve context and follow-ups. Automate feeds from your tools and run weekly huddles to convert insights into action. Keep it tight and metric-driven — continue for templates, integrations, and coaching rituals that scale.
Key Takeaways
- Show real-time scores for appointments, demos, and write-ups using weighted points to surface high-impact activities quickly.
- Integrate CRM, calendar, and demo tools via APIs or Coupler.io for automated, accurate leaderboard updates.
- Use progress bars, rank deltas, and minimal visuals to highlight trends, top performers, and activity gaps at a glance.
- Configure alerts for completed demos or missing write-ups to prompt timely follow-up and data completeness.
- Review leaderboard metrics in weekly huddles, assign action items, and track conversion rates to improve pipeline outcomes.
Why a Sales Pipeline Leaderboard Matters for Team Performance
Because teams perform better when activity is visible, a sales pipeline leaderboard gives you real-time, data-driven clarity on who’s setting appointments, conducting demos, and writing opportunities, so you can pinpoint repeatable behaviors and scale them across the team. You’ll use sales pipeline management to centralize key metrics, so team performance isn’t anecdotal but measurable. By design, the leaderboard helps you track progress and drive sales through transparent ranking and timely updates. That visibility enforces accountability, nudging reps to sustain activity and adopt proven tactics. You’ll extract actionable insights to identify coaching needs, redistribute workload, and enhance productivity. In practice, this structured, process-oriented approach replaces guesswork with metrics-driven decisions that systematically improve outcomes.
Key Metrics: Tracking Appointments, Demos, and Write-Ups
A clear focus on three measurable activities—appointments set, demos delivered, and write-ups completed—lets you quantify outreach effectiveness and predict conversion outcomes. You should track appointments to spot engagement trends, correlate demo volume with product interest, and guarantee write-ups capture next steps. That data ties directly to conversion rates and overall sales performance.
- Measure appointments: set weekly targets, monitor trends, and adjust outreach to improve lead engagement.
- Monitor demos: log requests, assess demo-to-win ratios, and prioritize prospects showing product intent.
- Enforce write-ups: require concise follow-ups to preserve context, surface blockers, and enable repeatable actions.
Benchmarks translate to individual performance metrics, producing actionable insights that optimize the sales process.
Designing a Leaderboard That Drives Healthy Competition

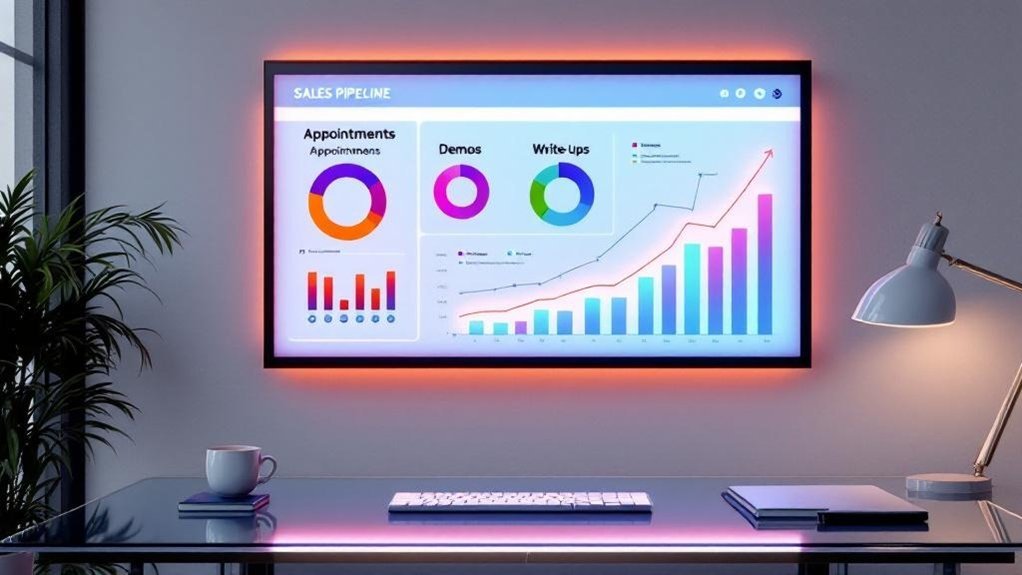
When you design a leaderboard that ties clear point values to appointments, demos, and write-ups, it becomes a real-time performance dashboard that nudges reps toward measurable behaviors; assign weights that reflect business impact, show progress bars and rankings for instant context, and update scores frequently so people can act on gaps instead of guessing. You’ll use the sales pipeline to quantify activity, set point values to align with revenue impact, and display rank and velocity so sales teams focus on the highest-leverage actions. Keep visuals minimal: progress bars, rank, and delta. Publish frequently to guarantee transparency and to motivate team members via visible gains. Celebrate top performers publicly to reinforce behaviors, sustain healthy competition, and drive productivity across the team.
Integrating Data Sources and Automating Updates
If you want the leaderboard to stay useful, integrate your CRM, calendar, and demo tools so appointments, demos, and write-ups flow in automatically and consistently into a single source of truth; use API connections or integration tools (Coupler.io, Zapier, native connectors) to map key fields, transform data, and push updates at set intervals or in real time. You’ll reduce manual data entry, increase data accuracy, and surface real-time data for sales performance metrics. Use cloud-based platforms so team members can access updated views and collaborate. Configure alerts for completed demos or write-ups to prompt timely follow-up. Monitor integration logs and refine mappings to prevent drift and guarantee reliable performance analysis.
- Standardize fields and timestamps.
- Automate updates and alerts.
- Audit logs for data accuracy.
Running Regular Reviews and Turning Insights Into Actions

You’ll run weekly pipeline huddles that review real-time leaderboard metrics for appointments, demos, and write-ups to spot trends quickly. For deals stalling, perform root-cause analysis using conversion rates and activity logs to pinpoint process or qualification gaps. Turn each insight into an actionable owner commitment with clear tasks, deadlines, and follow-up metrics.
Weekly Pipeline Huddles
Anyone leading weekly pipeline huddles should run tightly structured reviews that cover key metrics—appointments set, demos conducted, and write-ups completed—then analyze conversion rates from appointment→demo and demo→close to pinpoint where the process is leaking. You’ll use a Create-Advance-Close agenda to keep discussions focused on pipeline health and sales team performance metrics. Encourage collaboration: have reps share what drove successful appointments and demos, but avoid deep root-cause analysis in this forum. Capture clear action items with owners and deadlines so insights become measurable improvements. Use dashboards to track trends week-over-week and flag anomalies. Keep the meeting short, data-first, and outcome-oriented so the team moves from insight to execution consistently.
- Review metrics and conversion rates
- Share tactics and blockers
- Assign action items
Root-Cause Deal Analysis
When you run regular root-cause deal reviews, structure them to quickly surface where deals stall by stage, how long prospects linger, and which objections recur, then convert those findings into concrete actions with owners and deadlines. You’ll use root-cause analysis on deal movements in the sales pipeline to quantify bottlenecks and measure conversion rates, sales cycle length, and overall performance. Keep the Create-Advance-Close agenda tight and metric-driven.
| Focus | Metric |
|---|---|
| Stage stagnation | Avg days by stage |
| Lost deals | Top objections |
| Pipeline health | Conversion rates |
| Actions | Assigned owner + deadline |
Translate insights into refined sales strategies and accountability mechanisms so teams close gaps fast and improve measurable outcomes.
Actionable Owner Commitments
Root-cause deal reviews give you the where and why of pipeline drag; now convert those findings into named, time-bound owner commitments so fixes actually happen. You’ll run regular sales pipeline reviews with a tight agenda: surface key metrics (appointment rates, demo conversion percentages, write-ups), assign owners, and set specific deadlines for follow-ups. Timely actions boost conversion rates — sometimes by up to 50% — so make commitments measurable and short-cycle.
- Assign one owner per gap with a 48–72 hour deadline and measurable success criteria.
- Use leaderboard data to identify top performers and deploy targeted coaching to replicate behaviors.
- Track commitments in a feedback loop, report progress weekly, and iterate for continuous improvement and sustained performance.
Templates and Tools to Build Your Sales Pipeline Leaderboard
Choose templates that capture appointments, demos, and write-ups with customizable fields and clear metric calculations so you can compare performance consistently. Prioritize tools that support formulas and CRM connectors (Google Sheets/Excel, Smartsheet, HubSpot) to automate metric updates and reduce manual errors. Add AI meeting tools like Goodmeetings to extract action items and feed them into the leaderboard for real-time workflow automation.
Template Selection Criteria
Although picking a template might seem straightforward, you should prioritize integration with your CRM and real-time visualizations so data flows automatically and leaders can act on up-to-date metrics; also look for customizable fields (appointments, demos, write-ups), built-in formulas for win rates and average deal size, and a user-friendly layout to minimize errors and boost adoption. You’ll evaluate template selection by checking CRM integration depth, available automation tools, and whether real-time performance metrics update without manual import. Favor user-friendly designs that surface key metrics and reduce training time. Ascertain customizable features map to your sales pipeline stages and reporting needs. Use templates with built-in calculations to maintain data integrity and speed decision cycles.
- CRM integration
- Real-time metrics + automation
- Customizable, user-friendly fields
Automation and Integrations
When you automate integrations, your Sales Pipeline Leaderboard becomes a single source of truth that updates without manual effort—Coupler.io or native connectors can pull Salesforce records in real time, while Smartsheet, ClickUp and template-driven dashboards log appointments, demos and write-ups automatically; include tools like Goodmeetings to capture meeting insights and wire those fields into built-in formulas (win rates, avg deal size, demo conversion) so leaders see accurate, actionable metrics and teams spend time selling instead of reconciling data. You’ll integrate Salesforce data and CRM functionalities into templates that track appointments scheduled, demo conversions and write-ups, improving team productivity and sales operation consistency. Below is a compact tool checklist for implementation.
| Component | Purpose |
|---|---|
| Coupler.io | automate data sync |
| Smartsheet | template-driven tracking |
| ClickUp | task + pipeline management |
| Goodmeetings | meeting insight capture |
| Built-in formulas | performance analysis |
Frequently Asked Questions
What Is the 10 3 1 Rule in Sales?
The 10 3 1 rule means you contact 10 leads to set 3 appointments and secure 1 demo/close. You’ll use the 10 3 1 strategy with prospecting best practices, sales appointment techniques, effective follow up methods.
What Are the 4 Stages of the Sales Cycle?
The four stages are Prospecting, Qualification, Presentation, and Closing. You’ll use Sales cycle metrics for Importance stages, Customer engagement, Lead qualification, Objection handling, Closing techniques, Post sale follow up, and Sales forecasting to optimize results.
How to Visualize a Sales Pipeline?
Think of your pipeline as a river: use sales funnel visualization and data visualization techniques in pipeline management tools, enable CRM integration strategies, build interactive dashboards creation for sales metrics tracking, monitor lead conversion rates and performance analytics insights.
How to Structure a Sales Pipeline?
You structure a pipeline by defining clear pipeline stages, assigning sales metrics, standardizing lead management, mapping prospect engagement steps, applying conversion strategies, using sales tools for tracking, and aligning customer relationship processes with sales forecasting for continuous optimization.
Conclusion
A sales pipeline leaderboard boosts accountability and speeds revenue growth: teams using leaderboards see 18% higher quota attainment. You’ll track appointments, demos, and write-ups with clear KPIs, automated feeds, and weekly reviews so data drives behavior, not opinions. Build a simple dashboard, normalize sources, and run short action-focused meetings to fix gaps. Keep rules transparent, celebrate progress, and iterate metrics monthly to sustain healthy competition and measurable pipeline improvement.