
You’ll boost profit and cut wasted labor by showing real-time flagged vs sold technician hours on a visible digital sign. Display per-tech flagged hours, sold hours, and idle time with color bands and 30–60s refreshes. Link timecards and AI timestamps to automate logs, create audit trails, and surface bottlenecks. Use short-interval targets, gamified team metrics, and regular feedback sessions for buy-in. Keep metrics actionable and you’ll see measurable uplift — more on implementation and ROI follows.
Key Takeaways
- Display real-time flagged (actual) vs sold (billed) hours per technician to expose utilization gaps and lost revenue.
- Refresh data every 30–60 seconds with contrasting colors for quick identification of underperformance.
- Integrate time cards and AI timestamping to automate data, reduce payroll disputes, and ensure accurate audit trails.
- Use short-interval targets, team comparisons, and recognition to drive a 15–20% lift in billed hours.
- Involve technicians in metric design, provide training on discrepancies, and tie incentives to flagged vs sold hour goals.
Why Tracking Flagged Vs Sold Hours Matters for Profitability

Because flagged hours show what techs actually work and sold hours show what you bill, tracking the gap between them is essential to profitability: persistent discrepancies point to workflow inefficiencies, unapplied time and lost revenue, while real-time monitoring lets you adjust staffing and resource allocation to maximize technician utilization. You should measure flagged hours against sold hours per repair order, targeting 2–2.5 billed hours as a benchmark. If averages dip below that, run a root-cause checklist: task sequencing, tool availability, training gaps, or time-entry errors. Quantify unapplied time weekly, set corrective actions, and reassign staff to balance load. Use rolling 30-day trends to validate improvements. This procedural, data-driven loop directly raises technician productivity and profitability.
How Real-Time Digital Signs Change Technician Behavior
When technicians can see real-time digital signs showing flagged hours versus sold hours, they immediately adjust pacing and task choices to hit service targets. You’ll notice quicker task sequencing, fewer idle gaps, and choices that favor billable work. Data shows visibility drives a 15–20% rise in billed hours; you can replicate that by making metrics obvious and actionable. Use these steps to change behavior:
Real-time signs showing flagged vs sold hours prompt faster pacing, fewer idle gaps, and a 15–20% rise in billed hours
- Display individual and team flagged vs sold hours so technicians can compare in real time.
- Set short-interval targets (hourly) to prompt immediate pacing adjustments.
- Provide brief coaching when signs indicate underperformance to redirect tasks.
- Recognize visible improvements to reinforce productivity and sustain service focus.
Key Metrics Displayed on a Service Hours Leaderboard

Start by monitoring Flagged vs Sold Hours to spot mismatches between time logged and time billed, then prioritize corrective actions for recurring gaps. Track Technician Utilization Rate as a percentage of productive time versus available time to set realistic targets and allocate workloads. Use Real-Time Job Status updates to trigger follow-ups, adjust schedules, and confirm billing alignment immediately.
Flagged Vs Sold Hours
Think of flagged vs. sold hours as your real-time efficiency gauge: flagged hours show what technicians actually worked, sold hours show what you billed, and the gap between them highlights lost revenue or overreporting. You’ll use the Service Hours Leaderboard to monitor flagged hours vs. sold hours continuously, spot discrepancies, and act quickly to protect margin. Track technician productivity trends, isolate patterns of shortfalls, and assign corrective training or schedule adjustments. Use the board to enforce accountability and improve operational efficiencies through targeted interventions.
- Measure daily variance and flag anomalies.
- Prioritize technicians with recurring negative gaps.
- Adjust scheduling or dispatch based on trend data.
- Validate billing processes when sold hours exceed flagged hours.
Technician Utilization Rate
Efficiency is measured directly by technician utilization rate — total billable hours divided by total available hours — and it tells you how effectively your team is turning work time into revenue. You’ll calculate this metric continuously on the service hours leaderboard to track productivity and spot trends. Set 85% as the target threshold for a high-performing service center; rates below it trigger review. Use the display to highlight individual and team utilization, then assign coaching or redistribute workload where utilization lags. Cross-reference utilization with flagged vs sold hours to verify accuracy and prevent underbilling. Real-time visibility motivates technicians, reduces idle time, and shortens customer wait. Report weekly utilization summaries and corrective actions to maintain sustained improvement.
Real-Time Job Status
Having established how utilization rate flags under- or overbilling, you’ll want real-time job status on the service hours leaderboard to close the loop: display flagged hours vs. sold hours per technician, current job state (assigned, in-progress, paused, complete), start/stop timestamps, and percent of quoted labor consumed. You’ll use that data to monitor hours, quantify productivity, and drive corrective action. Update dashboards continuously so technicians and service advisors see the same truth. Present concise indicators and thresholds to trigger coaching or reallocation. Use the leaderboard for immediate decisions on staffing and customer communication. Implement accountability loops and store historical snapshots for trend analysis.
- Compare flagged vs. sold hours per technician
- Show live job state and timestamps
- Display percent of quoted labor consumed
- Surface outliers for manager intervention
Integrating Time Card Punch Systems With Live Displays
When you link time card punch systems to live digital displays, you get real-time visibility into hours flagged versus hours sold so managers can spot discrepancies immediately and reassign work to reduce idle time. You’ll set up feeds from punches to the display, map technician IDs, and define billed versus worked rules so time and productivity data align. Display panels should show per-technician hours flagged, hours sold, variance, and trending KPIs so service departments can prioritize assignments. Use thresholds and color codes for quick decisions, and log actions for audit trails to cut payroll disputes. Regularly validate punch-data accuracy, review mismatch causes, and iterate rules quarterly to sustain accountability and continuous productivity improvements.
AI Camera Tracking: PitCrew and Automated Labor Logs
Linking punch systems to live displays gives managers immediate hours visibility, but AI camera tracking like PitCrew automates that capture entirely, generating timestamped start/stop logs for each job without manual input. You’ll deploy ai camera tracking to produce automated labor logs that record presence, activity, and job boundaries. That data removes guesswork, reduces payroll disputes, and delivers real-time visibility into technician utilization for scheduling decisions.
- Install cameras oriented to service bays with privacy zoning and calibrated detection thresholds.
- Configure job mapping so timestamps attach to specific RO numbers and tasks.
- Monitor dashboards to identify idle time, queue bottlenecks, and utilization ratios.
- Export logs for payroll reconciliation, performance reviews, and continuous workflow optimization.
Designing a Clear and Motivating Digital Sign Layout
You’ll show real-time hours flagged versus sold prominently so staff can read live gaps at a glance. Use color-coded goal progress indicators and percentage bars to quantify distance to daily and weekly targets. Update the display every 1–5 minutes and include thresholds that trigger alerts for managers when progress falls below set benchmarks.
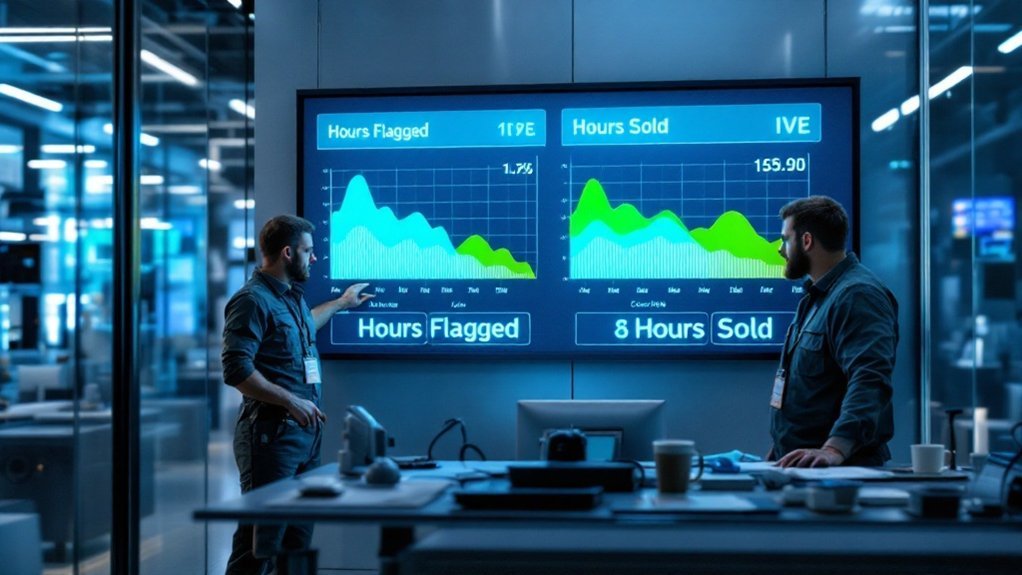
Real-Time Hours Display
A clear real-time hours display should show flagged versus sold hours side-by-side with high-contrast colors, live data refresh, and concise benchmarks so technicians and managers can instantly assess gaps and act. You’ll use real-time data feeds to keep numbers current, reducing lag that hides productivity challenges. Design the layout to make discrepancies obvious, prompt quick corrective steps, and reinforce accountability without ambiguity. Place signs where staff congregate so visibility supports culture change and technician training can reference the display during coaching. Procedural guidelines: what updates feed in, refresh cadence, ownership, and escalation thresholds.
- Use contrasting color pairs for flagged vs sold.
- Refresh data every 30–60 seconds.
- Tie display metrics to training interventions.
- Define escalation steps for persistent gaps.
Goal Progress Indicators
When designers align progress indicators with real-time flagged vs. sold hour feeds, technicians can instantly see where they stand and what action to take next. You should place a primary bar showing flagged hours against sold hours with numeric and percentage values updated live. Use color bands (red/amber/green) tied to productivity thresholds so status is scannable from distance. Include individual and team performance metrics in separate rows, updating at fixed intervals to prevent flicker. Add a compact goal line and delta value to show remaining hours to target and recent trend arrows to indicate momentum. Reserve a small area for a rotating motivational quote or quick success stat to reinforce behavior without obscuring data. Prioritize high-contrast fonts and simple icons.
Using Live Data to Identify Workflow Bottlenecks
If you track flagged technician hours against hours sold in real time, you’ll quickly spot workflow bottlenecks that cost productivity. You use real-time digital displays to track technician activity, compare flagged versus sold hours, and surface deviations immediately. With live data you’ll identify where jobs pile up, who’s idle, and which service types repeat delays, enabling rapid corrective action and enhancing efficiency.
- Monitor discrepancies minute-by-minute to locate queue buildup points.
- Reassign technicians based on live load to reduce idle time.
- Correlate recurring delays to service type or individual performance for targeted intervention.
- Use trend data from displays to adjust staffing and SOPs for sustained throughput gains.
Follow this procedural loop: detect, analyze, reallocate, and verify.
Best Practices for Technician Buy-In and Adoption

Start by bringing technicians into planning sessions so they’ll own the rollout: involve them in display placement, metric definitions (flagged vs. sold), and threshold settings, then provide concise, hands-on training that shows how to read the live dashboards, interpret discrepancies, and act on them. Next, implement a feedback loop with regular check-ins and documented suggestions to guarantee open communication and iterative refinement. Define clear incentives tied to flagged vs. sold hour targets to drive technician accountability; publish monthly scorecards so progress is transparent. Share brief success stories showing how service boosts customer satisfaction and link outcomes to individual actions. Finally, standardize procedures for responding to alerts so everyone knows steps, responsibilities, and how productivity refers to measurable time-on-task improvements.
Measuring ROI: From Reduced Idle Time to Higher Sales
Start by tracking idle time before and after you implement real-time digital signs to quantify decreases and link those reductions to increases in billable hours. Use the observed percentage drop in downtime (for example, a 10% reduction) to model revenue uplift and calculate labor ROI by comparing incremental billable hours and average hourly rate against system and training costs. Repeat the measurement monthly to validate trends, refine targets, and report clear ROI to stakeholders.
Decreasing Idle Time
When you track technician hours flagged versus hours sold in real time, you’ll turn hidden downtime into measurable revenue gains: cutting idle time by up to 20% can add $1,000–$2,000 in weekly sales per tech and improve productivity by as much as 15%. You’ll measure decreasing idle time by comparing flagged vs sold technician hours on a real-time sign, then act on gaps. Use data to prioritize tasks, reassign work, and close small inefficiencies that compound.
- Log flagged vs sold hours every shift and review exceptions.
- Trigger reassignment when idle exceeds a set threshold.
- Adjust workflows where repeated gaps appear.
- Report customer satisfaction and productivity changes weekly.
This process raises labor utilization and profitability.
Boosting Billable Hours
Although it may seem small, tracking flagged versus sold hours in real time turns hidden downtime into measurable revenue: cutting idle time lets skilled techs reach the 10–12 billable hours/day benchmark and can add $1,000–$2,000 in weekly sales per tech; for example, an efficient $39/hr tech billed 8 hrs/day generates about $4,000/week versus $2,650/week for a $25/hr tech billed 5.3 hrs/day. You’ll deploy digital signage to surface discrepancies between flagged and sold hours, then prioritize corrective actions: reassign tasks, refine scheduling, and standardize job sheets. Monitor technician performance metrics daily, set productivity targets, and run short-cycle audits. The result is reduced bottlenecks, higher billable hours, improved service delivery, and measurable revenue gains.
Calculating Labor ROI
Because labor ROI hinges on the gap between flagged hours and hours actually sold, you should quantify that variance daily and convert it into dollars to reveal where idle time erodes revenue. Start by extracting flagged vs sold hours per technician, multiply by your labor rate, and log the daily loss. Track productivity trends — for example, boosting productivity from 75% to 85% can add roughly 2 billed hours per technician per day. Compare billed hours per repair order against the 2–2.5 target to spot underperformance. Use real-time digital tools to trigger corrective actions and reduce unapplied time.
- Measure daily variance and dollarize it.
- Monitor technician productivity per shift.
- Compare billed hours per repair order to target.
- Trigger real-time interventions to cut idle time.
Scaling Real-Time Displays Across Multiple Bays and Locations
If you want consistent, real-time visibility across multiple bays and locations, deploy cloud-connected digital displays that show flagged hours versus sold hours per technician and per bay, updating instantly so managers can spot discrepancies and rebalance workloads. You’ll standardize metrics, push updates centrally, and configure each sign to show technician performance and productivity percentages by bay. Rollout procedure: audit bays, define KPIs, map network endpoints, deploy signs, set permissions, and schedule monitoring. Use alerts for deviations and weekly reports to track operational efficiency gains. Expect improved accountability and measurable productivity lifts. Example visual mapping:
| Bay | Metric | Action |
|---|---|---|
| Bay A | 92% productivity percentages | Rebalance tasks |
| Bay B | Flagged > sold | Investigate billing |
Frequently Asked Questions
How Do You Calculate Technician Productivity?
You calculate technician productivity by dividing hours spent working by hours clocked in, then multiplying by 100. Use productivity metrics for performance analysis, apply time management and workflow optimization steps to improve results.
How to Measure Technician Performance?
You measure technician performance using performance metrics like productivity and unapplied time, set clear goals, provide real time feedback, track data-driven KPIs, and invest in technician training, then iterate procedures based on measured outcomes.
What Things Impact a Technician’s Efficiency?
Think of inefficiency as “soft friction”: you’ll improve by optimizing work environment, raising skill level, ensuring tool availability, implementing training programs, reducing idle time, tracking outputs, and enforcing standard procedures to boost billed hours.
What Is the Difference Between Productivity and Efficiency of a Technician?
Productivity measures your time usage (hours working ÷ hours clocked) while efficiency measures speed relative to billed hours (can exceed 100%). Use productivity metrics, efficiency benchmarks, technician workload data and performance analysis to optimize staffing.
Conclusion
You’ll want to keep tracking flagged versus sold hours like a pulse—consistent monitoring shows where profit leaks occur and where coaching pays off. Use real-time displays tied to timecards or AI camera logs to spotlight idle time, throughput, and conversion rates. Regularly review leaderboard data, address bottlenecks with targeted process changes, and measure ROI by reduced non-productive minutes and increased sold hours. Iterate and scale successful protocols across bays and sites.