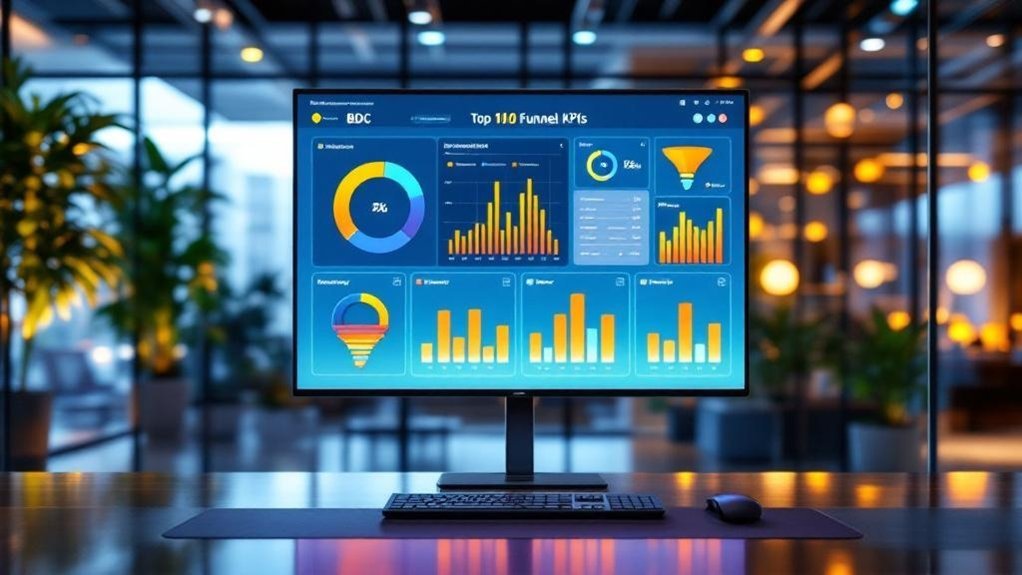
You’ll want ten concise, actionable KPIs on your BDC wallboard: Sales Target vs Actual (variance, $-to-go), Monthly New Leads by source, Lead Conversion Rate (lead-to-appointment), Opportunity-to-Close Rate, Average Deal Size, Pipeline Value by Stage, Deal Velocity (stage dwell times), Top Reps and Win Rates, Disqualified Lead Reasons, and Customer Retention/Churn. Track daily with owner tags, color thresholds, and trend lines to trigger coaching and reforecasting. Keep watching for tactical setup and visualization tips.
Key Takeaways
- Lead volume by source (daily/weekly) to identify high-yield channels and spot sudden drops.
- Lead-to-appointment conversion rate to measure initial outreach effectiveness and coach reps.
- Opportunity-to-close rate (pipeline conversion %) to evaluate funnel health and forecast accuracy.
- Pipeline value by stage with count and average deal size to prioritize high-impact opportunities.
- Sales velocity (average days per stage) to spot bottlenecks and accelerate time-to-close.
Sales Target vs. Actual Performance

A clear, up-to-date comparison of sales targets versus actual performance shows precisely where you’re over- or under-delivering and drives the corrective actions you need; by tracking variance (%) and absolute dollars daily or weekly on your wallboard, you can spot trends, assign responsibility, and adjust forecasts or tactics in real time to close gaps and hit strategic revenue goals. You’ll set sales targets that reflect strategy and market conditions, then feed actual performance into simple visual widgets. Focus on metrics to track: variance (%), dollars-to-go, velocity, and conversion rate. Use color-coded thresholds and owner tags so accountability’s clear. Review deviations promptly, reallocate effort, and test tactical shifts. Repeat weekly to sustain momentum and improve outcomes.
Monthly New Leads
Look at monthly new leads by source and track how each channel contributes to total volume so you can reallocate budget to the highest-yield funnels. Monitor lead quality trends alongside volume—conversion rates and average deal size per source will tell you which channels are producing actionable prospects. Set monthly benchmarks for both source mix and quality metrics to drive focused improvements and measure campaign impact.
Lead Source Breakdown
Monthly lead source breakdowns show exactly where your new leads are coming from, so you can quickly spot which channels (social, referrals, website, etc.) are driving volume and which need pruning or investment. Use this lead source breakdown to measure marketing efforts and steer budgets toward channels that produce the most new leads. Track monthly shifts to catch early trends and reallocate resources before performance drops. Focus on channels with consistent growth and test small boosts on underperformers. Report percentages and raw counts on your BDC wallboard so your team reacts in real time.
| Source | Count | % of Total |
|---|---|---|
| Social | 420 | 35% |
| Website | 480 | 40% |
| Referrals | 300 | 25% |
Lead Quality Trends
Lead Quality Trends show not just how many new leads you’re getting each month but how likely those leads are to convert, letting you prioritize channels and campaigns that actually move deals forward. Track Monthly New Leads alongside conversion rates to spot whether growth is real or just noise. Compare channels by lead conversion percentage to reallocate budget toward sources delivering qualified prospects. Watch cohort trends—does lead quality dip when volume spikes? If so, tighten targeting or creative to better match your target audience. Use these insights to set thresholds for acceptable lead quality and trigger follow-up experiments: refine audience segments, adjust offers, or pause underperforming campaigns. Report weekly and monthly to keep the pipeline healthy and predictable.
Lead Conversion Rate
Track your lead conversion rate alongside the lead-to-appointment ratio to see what share of leads are turning into scheduled meetings. Measure opportunity conversion speed to understand how quickly appointments become qualified opportunities and where time lags reduce throughput. Use these two rates to pinpoint funnel stages that need process changes or targeted messaging to boost overall conversions.
Lead-to-Appointment Ratio
When you convert a higher share of incoming contacts into scheduled appointments, you get a clear signal that your initial outreach and qualification are working; the Lead-to-Appointment Ratio measures that signal as (Appointments Scheduled ÷ Total Leads) × 100. You’ll use the lead-to-appointment ratio to quantify how well your team turns interest into customer interactions. Track conversion rates over time to spot trends, validate messaging, and test outreach tweaks. Aim for benchmarks between 10%–30% depending on your sector, and flag sudden drops for immediate root-cause analysis. Report the metric daily on your BDC wallboard, paired with lead volume, so you know whether changes in appointments reflect process issues or simply fewer leads. Use it to prioritize coaching and script optimization.
Opportunity Conversion Speed
Although it measures more than just speed, Opportunity Conversion Speed (Lead Conversion Rate) lets you quantify how effectively leads become customers using (Conversions ÷ Total Leads) × 100, so you can spot weak points in your funnel quickly. You should track this KPI on your BDC wallboard to monitor trends, benchmark performance (2–5% average, >10% top performers), and drive accountability across the sales team. Compare periods, segments, and campaigns to find where engagement drops and refine messaging or follow-up cadence to lift your lead conversion rate. Use the table below for quick snapshots and action triggers.
| Metric | Current | Action |
|---|---|---|
| Lead Conversion Rate | 4.2% | Improve follow-up speed |
| Trend (90d) | +0.3% | Maintain best channels |
| Target | 10% | Optimize funnel stages |
Opportunity-to-Close Rate
One key metric you should watch is the Opportunity-to-Close Rate, which tells you what percentage of sales opportunities actually become closed deals and directly reflects your sales process effectiveness. The opportunity-to-close rate is calculated as (closed deals / total opportunities) × 100 and is one of the core sales conversion key performance indicators (KPIs) you’ll use to judge funnel health. Track it over time to spot trends and trigger interventions when performance dips.
Watch Opportunity-to-Close Rate — the percent of opportunities that become deals. Track monthly to spot trends and act.
- Calculate monthly to monitor short-term changes.
- Benchmark against industry standards (above 20% is strong).
- Use declines to diagnose lead quality, training, or process gaps.
Display this KPI on your BDC wallboard to drive data-driven coaching and rapid corrective action.
Average Deal Size
You’ll calculate Average Deal Size by dividing total revenue by the number of closed deals for the period to get a clear per-deal revenue benchmark. Monitor changes in this metric to quantify its impact on overall revenue and to project how shifts in deal size affect your sales targets. Use targeted strategies—upselling, cross-selling, and pricing adjustments—to systematically raise average deal value and track results.
Calculating Average Deal
Average Deal Size gives you a clear metric of revenue per closed transaction by dividing total revenue from deals by the number of deals closed in a given period; this simple formula helps track pricing effectiveness, upsell/cross-sell success, and shifts in customer value so you can spot trends and adjust tactics quickly. Calculating Average Deal is straightforward: use Total Revenue from Deals ÷ Number of Deals Closed. You’ll monitor this Key Performance Indicator (KPI) alongside other metrics to assess sales team effectiveness and product positioning.
- Measure: sum closed-deal revenue for the period.
- Divide: total revenue ÷ count of closed deals.
- Review: track changes over time to inform training, pricing, and bundling.
Report weekly to act fast.
Impact on Revenue
Although it’s a single metric, average deal size directly shapes revenue outcomes and tells you whether your pricing, upsell tactics, and target segments are actually moving the needle—track it against CAC and segment-level cohorts so you can prioritize efforts where deal values exceed acquisition costs, double down on high-value segments, and quickly adjust pricing or bundles when you see sustained declines. You should measure mean deal value per closed sale, segment by customer cohort, and trend it weekly or monthly to spot shifts. Rising average deal size signals effective upselling or stronger offers; declines flag pricing or demand issues. Use these insights to allocate marketing spend, forecast revenue generation, and evaluate customer acquisition efficiency without conflating volume with profitability.
Strategies to Increase
Boost deal values by combining proven tactics—upsells, cross-sells, tiered pricing, personalization, incentives, and sales training—each backed by measurable lifts (typical ranges: upsell/cross-sell 10–30%, tiering 15–25%, personalization up to 20%, incentives 5–15%, training 10–20%). You’ll target average deal size by aligning sales activities to buyer needs and tracking relevant KPIs.
- Prioritize bundled offers and cross-sell prompts in workflows to capture the 10–30% lift.
- Use tiered packages with clear value differentials; expect 15–25% movement to higher tiers.
- Add personalization, timed incentives, and training cadence; measure lift with deal-size, attach-rate, and conversion KPIs.
Monitor tests, iterate offers, and tie rep goals to these metrics so improvements reflect in pipeline velocity and revenue per deal.
Sales Funnel Velocity (Time in Each Stage)

When you track Sales Funnel Velocity, you’re measuring how long leads sit in each stage so you can spot slow points and act fast. Use sales funnel velocity to calculate average time in each stage, then map those times against conversion rate per stage to prioritize fixes. If a stage shows long dwell time and low conversion rate, redesign touchpoints, add nurturing cadence, or reassign reps to reduce bottlenecks. Shorter time in the funnel usually lifts overall conversion rate and improves forecasting accuracy; track rolling averages weekly to detect trends. Display stage-level time metrics, target benchmarks, and overdue counts on your BDC wallboard so your team can take immediate, measurable actions to accelerate flow and close more deals.
Pipeline Value by Stage
Because pipeline value by stage aggregates the total potential revenue across each funnel step, you can quickly spot where money is piling up or leaking and prioritize actions accordingly. Use pipeline value on your BDC wallboard to visualize the sales funnel and surface stage-level metrics that drive decisions. Display stage totals alongside lead counts and average deal size so you know not just volume but real revenue exposure.
- Track stage value, lead count, average deal size to spot bottlenecks.
- Update metrics in real time to prioritize high-value, high-probability opportunities.
- Focus rep activity on stages with high value but low conversion to improve throughput.
This keeps the team aligned, accountable, and focused on converting the highest revenue potential.
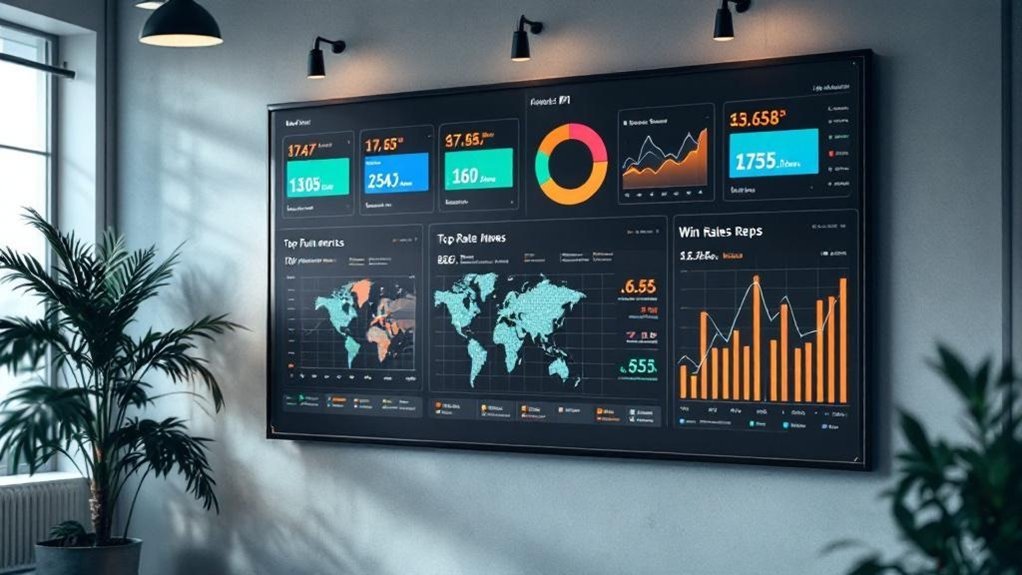
Top Sales Reps and Their Win Rates
Highlighting your top sales reps and their win rates on the BDC wallboard gives a concise, data-driven snapshot of individual effectiveness: display top performers with current win rates (closed deals ÷ opportunities) and recent trend arrows. You’ll motivate the team by setting clear benchmarks and make coaching decisions from hard data. Pair win rates with sales volume to avoid rewarding quantity over quality, and update frequently to capture momentum shifts. Use the wallboard to flag consistent top performers for peer-led best-practice sessions, and identify reps whose win rates are declining so you can target training. These visible metrics let you correlate techniques with sales performance, iterate on processes that drive higher conversion, and keep goals transparent and actionable.
Disqualified Lead Reasons
Someone on your team should be tracking why leads get disqualified so you can turn those reasons into concrete improvements. Disqualified leads aren’t failures—they’re data points that reveal flaws in lead qualification and gaps between your offer and customer expectations. Use your BDC wallboard to display top disqualification reasons and prompt corrective actions.
- Budget constraints — adjust targeting and pricing communication.
- No current need — refine intent signals and nurture paths.
- Audience mismatch — retune acquisition channels and ICP.
Regularly analyze patterns: quantify frequency, map reasons to channels, and test messaging adjustments. Set weekly targets to reduce repeatable disqualification causes and track improvement in lead qualification metrics. This creates accountability and closes feedback loops between marketing and sales.
Customer Retention and Churn Rate
Retention is the percentage of customers who keep buying from you over a set period, and tracking it alongside churn rate (lost customers ÷ starting customers × 100) tells you whether your revenue base is stable or slipping. You should monitor customer retention monthly and annually; a high retention rate signals effective loyalty efforts, while churn rate above 10% usually demands immediate action. Benchmark churn rate — ~5% annually is often acceptable — and set targets to reduce it. Improving customer retention by just 5% can boost profits 25–95%, so prioritize initiatives with measurable impact: targeted onboarding, prompt issue resolution, and feedback loops tied to win-back campaigns. Regularly analyze churn drivers from surveys and behavior data to decide which tactics to deploy.
Frequently Asked Questions
What Are the Most Popular KPIS?
The most popular KPIs are website traffic, lead generation rates, CTR, CPL and top-funnel conversion rates; you’ll use popular metrics with clear data visualization for concise performance measurement, so monitor trends and optimize campaigns accordingly.
What Are the 4 KPIS Every Manager Has to Use?
You should track Sales Performance, Lead Conversion, Customer Acquisition Cost, and Customer Lifetime Value — they’ll show conversion efficiency, cost per customer, long-term revenue, and guide Customer Engagement improvements so you can optimize tactics and resource allocation.
What Is a Funnel KPI?
Like a thermometer for deals, a funnel KPI is a measurable metric showing funnel performance and guiding kpi tracking to improve sales conversion; you’ll use it to spot drop-offs, prioritize fixes, and drive repeatable revenue gains.
What Are the 4 P’s of KPI?
The 4 P’s of KPI are Purpose, People, Process, and Performance. You’ll link purpose to key indicators, assign people to own performance metrics, standardize process for data visualization, and iterate actions from measured results.
Conclusion
You’ve got the metrics that move revenue — track targets vs. actuals, new leads, conversion and opportunity-to-close rates, average deal size, pipeline by stage, rep win rates, disqualified reasons, and retention/churn. Use this wallboard to spot leaks fast and act: reallocate reps, prioritize high-value deals, and fix recurring disqualifications. Visualize your funnel like a pressure gauge — when it spikes, you’ll know exactly where to tighten or release to hit quota every month.