
You need a digital price comparison board to show real-time service rates, highlight competitor gaps, and standardize prices across channels so your fixed ops team wins customers and protects margins. It cuts repetitive inquiries, speeds advisor decisions, and links with your DMS/CRM to eliminate manual errors. Dynamic pricing triggers improve profitability while transparent menus build trust and foot traffic. Metrics like conversion, engagement, and revenue per visit become measurable — keep going to see how to implement and measure it.
Key Takeaways
- Provides real-time service pricing to build customer trust and reduce repetitive cost inquiries.
- Enables dynamic, market-aligned pricing to protect margins and respond to competitor moves instantly.
- Automates price syncs with DMS/CRM, eliminating manual errors and ensuring consistent offers across channels.
- Empowers service advisors with quick insights, improving conversion rates and advisor-customer pricing conversations.
- Reveals demand and pricing trends for targeted promotions, boosting upsells and average service revenue.
Key Benefits of a Digital Price Comparison Board for Fixed Ops Managers
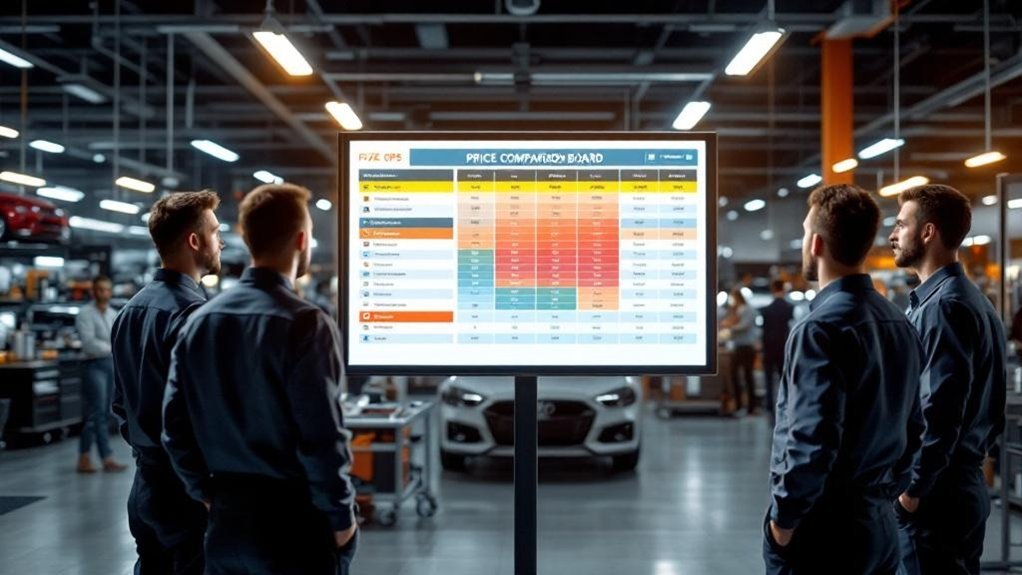
Because transparency drives trust and operational efficiency, a digital price comparison board gives you a concise, data-backed way to display service prices in real time, reduce repetitive cost inquiries, and empower service advisors to communicate value—actions that have been shown to boost service-department revenue by as much as 28%. You’ll use the board to improve customer engagement by showing clear, comparable prices before arrival, which raises satisfaction scores and shortens decision cycles. Operationally, it consolidates competitive data so you can benchmark quickly and keep your pricing strategy aligned with market trends. That consolidation reduces manual pricing errors, speeds adjustments based on demand, and frees advisor time for upsells. In short, it’s a tactical tool that links transparency, efficiency, and measurable revenue gains.
How Real-Time Pricing Data Drives Competitive Advantage
When you tap into real-time pricing data, you gain the agility to match or undercut competitors the moment market conditions shift, turning pricing from a static policy into a tactical lever. You’ll monitor competitor pricing strategies continuously, enabling dynamic adjustments that preserve margin while winning work. That speed cuts research time, so you can redeploy staff to streamline service flow and improve customer experience. Current pricing feeds reveal trends and customer preferences, informing targeted promotions and service bundling as part of broader pricing strategies. Transparency from live comparisons builds trust — customers see fair, market-aligned rates — which boosts satisfaction and repeat business. Ultimately, data-driven competitive pricing improves absorption by attracting volume without eroding profitability.
Integrating Price Comparison Boards With Your DMS and CRM

The agility you gain from real-time pricing only pays off if those price signals feed directly into the systems your team uses every day; integrating a digital price comparison board with your DMS and CRM automates price updates, removes manual entry errors, and keeps service menus and customer records synchronized. You’ll reduce discrepancies, improve price accuracy, and accelerate decision cycles for service advisors. Expect integration challenges—API mapping, data models, and update cadence—but the payoff is measurable: fewer corrections, faster quotes, and consistent customer-facing information. Use monitoring dashboards and audit logs to validate syncs. Below is a concise operational guide to priorities and outcomes.
| Priority | Outcome |
|---|---|
| Sync reliability | Consistent prices |
| Auditability | Reduced disputes |
| Latency control | Faster quoting |
Using Price Transparency to Build Customer Trust and Increase Foot Traffic
Make your service pricing visible and you’ll convert skepticism into measurable trust — industry research links transparent offerings to a 70% increase in customer trust and satisfaction. By showing clear, comparable local prices on a digital board you cut redundant cost inquiries, boost advisor efficiency, and attract the 81% of consumers who prefer upfront pricing. The result is an operationally scalable competitive advantage that can lift foot traffic and drive up to a 30% increase in service appointments.
Transparent Service Pricing
Why should you hide service prices when transparently posting competitive, clearly formatted rates online can boost foot traffic by up to 25% and cut service-cost inquiries by roughly 30%? You need to meet customer expectations: 70% expect prices online before deciding. Implementing pricing transparency via a digital price comparison board reduces repetitive calls, frees advisor time, and standardizes quote delivery so technicians and service writers operate with consistent targets. That operational clarity drives a 15% lift in repeat business by emphasizing value, not just discounts. Because 60% of consumers prioritize transparency over cost, visible pricing lets you neutralize aftermarket objections and convert intent into appointments. Measure conversion rates, inquiry volumes, and repeat visits to prove ROI quickly.
Competitive Local Comparisons
When you put your service rates side-by-side with local competitors on a digital comparison board, you’re not just listing prices—you’re signaling transparency and operational confidence that converts browsers into appointments; research shows 70% of customers want prices upfront, and dealerships that do this see measurable lifts in foot traffic, customer satisfaction, and repeat service business. You’ll use local competitor analysis to benchmark labor and parts pricing, then implement pricing strategy alignment that preserves margin while positioning your OEM value proposition. That clarity reduces inquiry friction, attracts price-sensitive and value-driven customers, and differentiates factory-certified service from aftermarket alternatives. Track board-driven conversions, customer satisfaction gains (typically +15%), and repeat appointment rates to optimize offers and operational throughput.
Strategies for Dynamic Pricing to Maximize Service Profitability
Although dynamic pricing demands constant monitoring, it lets you align service rates with real-time market signals so profitability and competitiveness move in lockstep; you’ll use automated feeds from a digital price comparison board to spot gaps and adjust quickly. Focus on data-driven triggers — competitor shifts, appointment demand, and price sensitivity — to tune service profitability without eroding trust. Update menus regularly for transparency and retention, and segment offers by vehicle type or urgency to capture willingness to pay. Operationalize rules: caps, floors, and review cadences so staff can execute consistently. Use analytics for predictive adjustments, not guesswork, and monitor margin impact continuously to guarantee net gains.
| Trigger | Action | KPI |
|---|---|---|
| High demand | Raise price 5–10% | Margin % |
| Low demand | Offer bundle | Utilization % |
| Competitor drop | Match selectively | Win rate % |
Identifying Market Trends and Pricing Opportunities With Analytics
Because real-time analytics from a digital price comparison board give you continuous market visibility, you can spot emerging trends—like seasonal demand shifts, competitor discount patterns, or growing preference for express services—and convert them into actionable pricing opportunities; use these signals to test targeted price adjustments, segment offers by vehicle type or customer cohort, and prioritize changes that improve absorption and margin without compromising perceived OEM value. With structured market analysis you’ll identify gaps between your service rates and aftermarket competitors, then apply pricing strategies that reflect OEM quality while matching customer expectations. Use data to validate promotions, refine service bundles, and drive operational efficiency. Key analytics to monitor include:
Real-time comparison insights reveal trends—seasonal shifts, competitor discounts, service preferences—turning data into targeted pricing, better absorption, and OEM-aligned offers
- competitor price movements and response velocity
- customer preference clusters by service type
- margin impact per price change
- absorption trend correlations
Best Practices for Displaying Service Prices Across Digital Channels
If you want to build trust and reduce friction, put clear, searchable service prices where customers already look—on your website, mobile pages, and comparison boards—so they can evaluate value without calling in. Use data: 70% of consumers expect online prices, so prioritize visible, standardized menus that support pricing transparency and reduce routine inquiries. Tailor displays to customer preferences with segmented offers and dynamic modules that surface relevant services based on vehicle or location. Guarantee consistency across channels to avoid confusion and enable measurable KPIs: click-through rates, quote requests, conversion and call reduction. Highlight bundled value vs. aftermarket alternatives to capture price-sensitive shoppers. Regularly audit and A/B test wording, layout, and update cadence to keep information accurate and competitive.
Training Service Advisors to Leverage Price Comparison Insights
You’ll train advisors to read priceboards quickly so they can spot competitive gaps and opportunities in seconds, using real-time metrics to guide conversations. Practice will center on role-play pricing conversations that rehearse concise justification of costs and upsell moments tied to displayed data. Measure skill gains by tracking response times, conversion rates, and average repair order value after each training cycle.
Reading Priceboards Quickly
Anyone on your service team who can read a digital priceboard in seconds will turn pricing data into a competitive advantage, because quick interpretation lets advisors answer customer questions confidently, highlight value over cheaper competitors, and steer service selections toward higher-margin options. You’ll train for priceboard familiarity and embed pricing strategies into daily workflows so advisors react, not stall. Rapid reading reduces call/email volume and boosts conversions—training can lift department revenue up to 28%.
- Teach pattern recognition: common services, outliers, and regional variances.
- Standardize reference points: labor rates, parts markup, and promo indicators.
- Time-box drills: read-and-explain exercises under 30 seconds.
- Decision rules: when to match, justify premium, or upsell based on board data.
This operational approach turns insight into measurable performance.
Role-Play Pricing Conversations
When advisors practice role-playing pricing conversations using the digital price comparison board, they’ll build the muscle memory to cite real-time competitor data, explain OEM vs. aftermarket tradeoffs, and close on recommended services with measurable confidence; studies show this training reduces repeat pricing inquiries and can lift conversion rates by double digits, so schedule short, frequent simulations that focus on common objections, time-boxed responses, and clear decision rules for matching or justifying premiums. You’ll run targeted drills that mirror live customer scenarios, use role playing techniques to rehearse succinct pricing communication, and score outcomes against KPIs like time-to-close and inquiry reduction. This operational approach embeds data-driven narratives, reduces advisor anxiety, and increases retention by turning price comparisons into persuasive, trust-building tools.
Measuring ROI: Metrics to Track After Implementing a Price Board

Because clear measurement turns good intentions into repeatable business outcomes, you’ll want to focus on a concise set of metrics that directly tie the price board to revenue, efficiency, and customer behavior. Track service inquiries (expect ~20% lift) to validate transparency’s impact on trust and refine pricing strategies. Measure customer engagement rates (possible 25% rise) and conversion-to-booking (up to 15%) to quantify the funnel improvement. Monitor average service revenue per customer (potential 10% gain) to see upsell effects.
Focus on a few metrics—service inquiries, engagement, conversion, and revenue—to link your price board to measurable ROI.
- Service inquiry volume and source attribution
- Engagement rate with the price board (dwell, clicks)
- Booking conversion rate post-exposure
- Advisor productivity gains and time-to-close
Use these KPIs for iterative pricing strategies, operational adjustments, and clear ROI reporting.
Overcoming Common Implementation Challenges and Risks
Although a digital price comparison board can drive measurable gains, you’ll need a clear rollout plan that addresses integration, training, data accuracy, and competitive concerns to avoid implementation risks. You’ll map integration points, test APIs against legacy systems, and quantify downtime risk to confront implementation hurdles. Train technicians and service advisors with role-based modules and KPIs to reduce staff resistance and errors. Establish automated feeds and audit cycles to keep pricing accurate and protect customer trust. For competitive concerns, set visibility policies and monitor price elasticity data. Maintain an incident playbook and governance cadence to minimize operational disruption.
| Risk Area | Mitigation | Metric |
|---|---|---|
| Integration | API testing | Uptime % |
| Training | Role-based KPIs | Error rate % |
| Data Accuracy | Automated audits | Discrepancies/month |
| Competition | Visibility policy | Conversion rate % |
Frequently Asked Questions
What Does a Fixed Operations Manager Do at a Car Dealership?
You oversee fixed operations at a dealership, optimizing service workflows, managing advisors and technicians, tracking KPIs like ELR and efficiency, implementing training, using data-driven tools for performance, and driving revenue, quality, and customer retention.
What Three Departments Comprise the Fixed Operations of a Dealership?
They’re the service department, parts department, and body shop — you’ll optimize workflows, track KPIs, and align inventory and labor metrics to boost throughput, reduce costs, and improve customer retention across fixed ops.
What Is the Most Profitable Department in a Car Dealership?
You’ll find the service department is the most profitable, often boasting the highest profit margin due to smart pricing strategies; you’ll leverage data-driven tactics and operational discipline to boost absorption and sustain dealership financial health.
Do Dealerships Overpriced Cars?
Yes — you’ll often see higher car pricing at dealerships; data shows 5–10% markups and added fees. To improve dealership transparency, you should implement pricing audits, real-time comparison tools, and standardized fee disclosures.
Conclusion
You’ll quietly gain a competitive edge by installing a digital price comparison board — not a flashy gimmick, but a subtle productivity amplifier. With real‑time pricing tied to your DMS/CRM, you’ll nudge traffic, protect margins, and let advisors make smarter, faster decisions. Use transparent pricing to earn trust, apply dynamic strategies to lift per‑repair yields, and track clear KPIs to prove impact. Implement thoughtfully, and operational friction becomes a manageable, revenue‑positive detail.