
You need a single pane that consolidates store and regional sales KPIs so you can spot outliers, allocate resources, and drive accountability in near real time. It should show total sales, avg transaction value, growth %, and leading signals like leads and lead-to-sale time, with rooftop comparisons and regional rollups to reveal geographic trends. Embed action-item ownership, follow-up dates, and data lineage from a centralized warehouse for trusted, timely decisions. Keep going to see implementation and metrics.
Key Takeaways
- Consolidate multi-store sales into a single dashboard showing total sales, average transaction value, and sales growth by rooftop and region.
- Enable rooftop-level comparisons and regional rollups to quickly identify outliers, high-performing territories, and underperforming stores.
- Combine leading indicators (leads, lead-to-sale time) with lagging metrics (revenue, net margin) for balanced forecasting and evaluation.
- Assign and track action items with owners, due dates, and status to drive accountability and link interventions to sales goals.
- Centralize data with versioned mappings, ETL validation, and refresh cadences to ensure accurate, timely executive decision support.
Dashboard Overview and Core Metrics
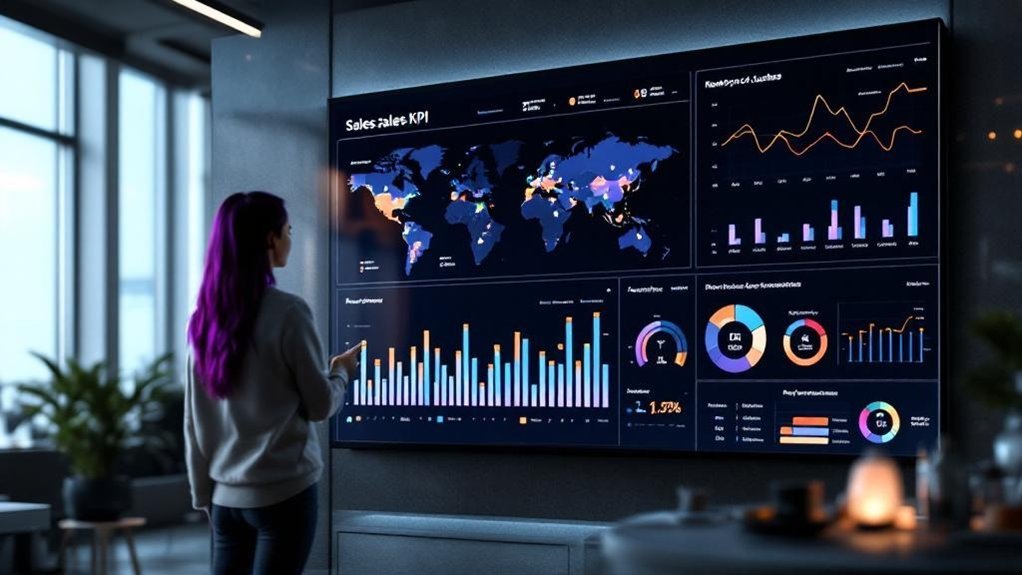
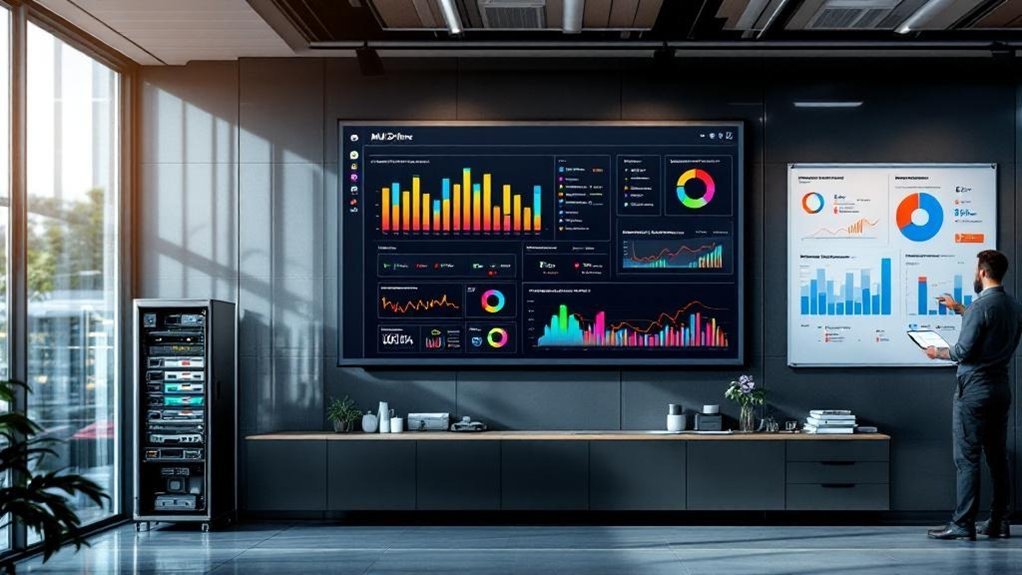
The Multi-Store Executive Rollup dashboard gives you a single, data-driven view of sales performance across stores and regions, consolidating revenue, average transaction value, and sales growth into clear visualizations. You’ll see core metrics—total sales volume, average transaction value, and sales growth percentage—presented in a visual interface that supports quick comparative analysis. Real-time data insights let you monitor trends and detect deviations from quotas, reinforcing accountability and enabling rapid corrective action. Consolidated revenue metrics from multiple sources reduce manual reconciliation, so strategic decision-making is based on consistent numbers. Charts and graphs prioritize actionable insights: top performers, underperforming locations, and trend signals tied to targets. You’ll use this concise dashboard to drive focused interventions and measure impact.
Aggregation by Rooftop: Comparing Store-Level Performance
Because rooftop-level aggregation lets you compare stores side-by-side, you’ll spot outliers in total sales, average transaction value, and conversion rates faster and act where it matters most. You’ll use the dashboard to benchmark store performance with key performance indicators, isolating high performers and underachievers across the multi-store operation. Historical sales data by rooftop uncovers consistent strengths or declines, informing resource allocation and targeted initiatives. That visibility drives data-driven decisions—shifting inventory, staffing, or local promotions to lift conversion and average ticket size. By focusing on rooftop comparisons, you measure regional sales effectiveness without conflating geographic trend analysis, and you create concise action plans that improve overall sales performance while preserving clarity for subsequent regional rollup assessments.
Regional Rollup: Identifying Geographic Trends

Anyone reviewing a regional rollup will quickly see where revenue, penetration, and conversion diverge across geographies, letting you target investments and campaigns to the areas that move the needle. A regional rollup in your sales KPI dashboard aggregates sales by region to expose geographic trends in revenue generation and market penetration, guiding strategic planning. You’ll identify high-performing territories for scale and underperforming areas for intervention, aligning targeted marketing strategies with local customer preferences. Real-time insights reveal seasonal swings and economic headwinds, improving forecasting accuracy. Use these data-driven decisions to reallocate resources, tailor product assortments, and optimize promotions. Executives gain agility: clear signals from regional rollups turn dispersed data into focused action.
Leading and Lagging Indicators to Watch
When you track both leading signals—like new leads generated and average lead-to-sale time—and lagging outcomes—such as total sales revenue and net profit margin—you’ll get a clear view of where future opportunities are forming and which tactics actually delivered results. You should balance leading indicators (customer inquiries, lead velocity) with lagging indicators (total sales revenue, customer retention rate) to measure sales performance and align with business goals. Use these performance metrics to compare rooftops and regions and to evaluate sales strategies.
- New leads generated — forecasts short-term demand.
- Average lead-to-sale time — indicates funnel efficiency.
- Customer inquiries — early signal to tweak sales tactics.
- Customer retention rate — confirms long-term strategy impact.
Action Items, Accountability, and Follow-Up Tracking
You’ll assign clear ownership for every action item so one person is accountable and progress is measurable. Track completion dates in the dashboard to quantify timeliness and flag overdue tasks for escalation. Link each action to specific sales goals so you can correlate execution with performance across stores.
Assign Clear Ownership
Assigning clear ownership for each action item guarantees there’s a single accountable person tied to a measurable outcome and deadline, which reduces ambiguity and improves follow-through. You should assign clear ownership when you log action items into your executive dashboards so responsibility is visible and linked to progress tracking. Use a structured system that records owner, status, and handoff notes to support follow-up tracking and management reviews.
- Define owner and expected outcome for every action item.
- Link items to executive dashboards for real-time accountability metrics.
- Use structured system fields (owner, status, notes) to enable auditability.
- Schedule standardized follow-up tracking cadence tied to management reviews.
This approach drives accountability, reduces slippage, and increases probability of project success.
Track Completion Dates
Because clear deadlines translate responsibility into measurable progress, tracking completion dates for action items is essential to sustaining sales momentum across stores and regions. You’ll use completion dates to drive accountability, linking each action item to a responsible owner and measurable sales KPIs so delays are visible and addressed. Centralized tracking improves transparency and enables inter-store collaboration by surfacing regional insights about what tactics lift sales performance. Regular follow-up against documented dates preserves project momentum and gives managerial oversight timely signals to remove roadblocks. Analyze completion-date patterns to evaluate strategy effectiveness across rooftops, then adjust resource allocation and timelines. By treating completion dates as data points, you’ll convert intentions into repeatable outcomes, speeding corrective action and boosting overall sales results.
Link Actions to Goals
When action items are explicitly tied to sales goals, you get measurable accountability: each task shows who’s responsible, which KPI it moves, and when progress should be reviewed. You’ll use the Sales KPI Dashboard to link actions to goals, ensuring transparency and collaboration across rooftops and regions. Embed action items, deadlines, and owners so you can monitor progress against sales targets with sales performance data. Regular reviews prevent unfinished work from eroding momentum and let you reallocate resources allocated where needed.
- Record action items with owner, target KPI, and due date.
- Review action items against sales performance data weekly.
- Adjust resources allocated when progress deviates from sales targets.
- Publish status for transparency and cross-team collaboration.
Data Sources, Integration, and Maintenance
You’ll start by mapping each data source—POS, CRM, inventory—to the specific KPI fields they feed, so ownership and data lineage are explicit. Then design integrations (API or ETL) with scheduled refresh windows that match decision cadence and guarantee near-real-time accuracy where it matters. Finally, set up automated data-quality checks and a maintenance schedule to catch drift, broken feeds, or schema changes before they affect reporting.
Data Source Mapping
Although consolidating multi-store sales data sounds straightforward, mapping your data sources is the strategic foundation that determines accuracy, timeliness, and trust in executive rollups. You’ll inventory POS, ERP, Salesforce, Shopify, and SQL systems, then define canonical fields so sales data and performance metrics align across rooftops and regions. Use ETL processes to standardize formats, enforce validation rules, and flag anomalies to protect data integrity. A centralized data warehouse lets you consolidate performance and power the sales KPI dashboard with accurate and up-to-date feeds. Maintain mappings with versioning and change logs so you can trace corrections. Prioritize sources by reliability and impact to streamline maintenance and focus efforts where they most improve executive visibility.
- Source inventory and canonical schema
- Field-level mapping rules
- ETL validation checkpoints
- Mapping governance and versioning
Integration & Refresh
Because executive decisions depend on timely, accurate signals, integrate your multi-store feeds with clear refresh policies and automated checks so data is current and trustworthy; set refresh cadences (real-time, hourly, daily) based on source volatility and decision impact, connect via reliable APIs or ETL to systems like POS, CRM, BigQuery, and cloud storage, and embed validation rules that flag schema drift, missing aggregates, or latency breaches for immediate remediation. You’ll design integration capabilities to ingest data from multiple sources into a single sales KPI dashboard, prioritizing data refresh rates that match operational needs. Implement automated data validation to detect discrepancies, drive faster remediation, and maintain a thorough view for performance tracking. That disciplined approach strengthens executive decision-making and reduces risk.
Frequently Asked Questions
What Is a KPI Dashboard for Executives?
A KPI dashboard for executives is your leadership tool delivering executive insights via data visualization and visual analytics for performance tracking, metric comparison, real time reporting and actionable intelligence to support strategic decision making and monitor business performance.
How Would You Approach Building a KPI Dashboard That Tracks Multiple Metrics Over Time?
You’ll start by defining metrics, then—before revealing dashboards—apply metric selection process, historical data analysis and KPI benchmarking methods, design with dashboard design principles, user experience focus, data visualization techniques, real time data integration, multi store comparison, visualization tools comparison for executive decision making.
What Is KPI in Sales Dashboard?
A KPI in a sales dashboard is a measurable indicator of Sales Performance; it’s the KPI Definition guiding Dashboard Design and Data Visualization for Metric Tracking, Sales Analysis, Performance Review, Executive Insights, Business Intelligence, and driving Revenue Growth.
Which KPIS Can You Impact to Drive More Sales in Your Store?
You can impact Sales Conversion, Customer Retention, Average Transaction and Inventory Turnover to drive Sales Growth; optimize Employee Performance, Pricing Strategy and Marketing ROI, boost Customer Satisfaction, and improve Lead Generation to lift overall store revenue.
Conclusion
You’re steering a fleet of rooftops like a captain watching charts: the dashboard is your compass, the KPIs your wind. Use rooftop rollups to spot gusts, regional views to map currents, and leading indicators to trim sails before storms. Assign clear owners, track actions, and keep integrations clean so data stays true. Stay strategic and disciplined—small course corrections now will steer performance toward predictable, measurable growth.